
Figure 2. Mouse-adapted MERS-CoV causes fatal disease in 288/330+/+ mice.
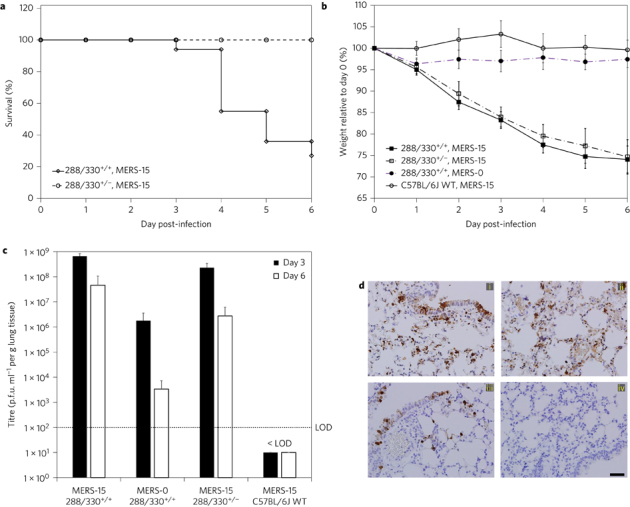
Mice were inoculated intranasally with 5 × 10⁶ p.f.u. a, Mortality of 288/330+/− (n = 10) and 288/330+/+ (n = 16) mice was monitored daily up to day 6 p.i. Data show the percentage of surviving mice. b, Mouse weights were measured daily up to day 6 p.i. for 288/330+/+ mice infected with MERS-15 (n = 16) or MERS-0 (n = 10), 288/330+/− mice infected with MERS-15 (n = 10) and C57BL/6J wild-type (WT) mice infected with MERS-15 (n = 7). Data are daily means of the percentage weight relative to day 0 ± s.d. c, Viral lung titres for MERS-CoV were determined at day 3 p.i. (288/330+/− + MERS-15, n = 4; 288/330+/+ + MERS-15, n = 5; 288/330+/+ + MERS-0, n = 5; C57BL/6J WT + MERS-15, n = 4) and day 6 p.i. (288/330+/− + MERS-15, n = 4; 288/330+/+ + MERS-15, n = 4; 288/330+/+ + MERS-0, n = 5; C57BL/6J WT + MERS-15, n = 3). The limit of detection (LOD) is indicated. Bars are means + s.d. d, Immunohistochemistry of lung sections for anti-MERS nucleocapsid at 3 days p.i. Results show 288/330+/+ mice + MERS-15 (i), 288/330+/− mice + MERS-15 (ii), 288/330+/+ mice + MERS-0 (iii) and C57BL/6J WT mice + MERS-15 (iv). IHC images are representative of at least three samples. Scale bar (d), 1 mm.