
Fig. 3.
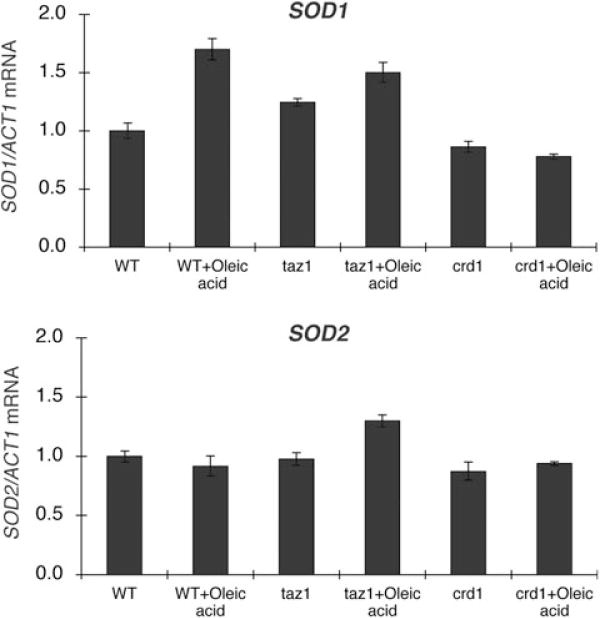
SOD1 and SOD2 expression in CL mutants. Cells were grown in YPE (0.75% ethanol) plus or minus 1 mM oleic acid at 37°C to the early stationary phase. Total RNA was extracted, and SOD1 and SOD2 mRNA levels were determined by real-time PCR as described under Experimental procedures. The expression of SOD1 and SOD2 was normalized to the RNA levels of the internal control ACT1. Data are the average of three independent experiments.