
Fig. 5.
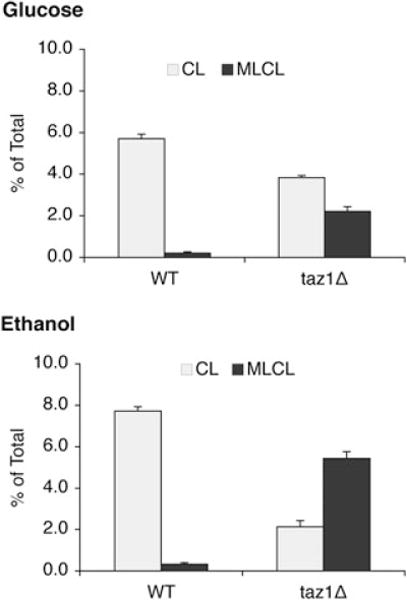
The taz1Δ mutant exhibits increased MLCL and decreased CL in response to ethanol. Cells were grown in YPD or YPE (0.75% ethanol) at 37°C to the early stationary phase. Cells were harvested by centrifugation, and lipids were extracted and separated as described in Experimental procedures. Phospholipids were separated by one-dimensional TLC and visualized by phosphorimaging. CL and MLCL were quantified using ImageQuant software. The relative amount of 32P in CL and MLCL is presented as a percentage of the 32P incorporated into total phospholipids. Data represent the average of three independent experiments.