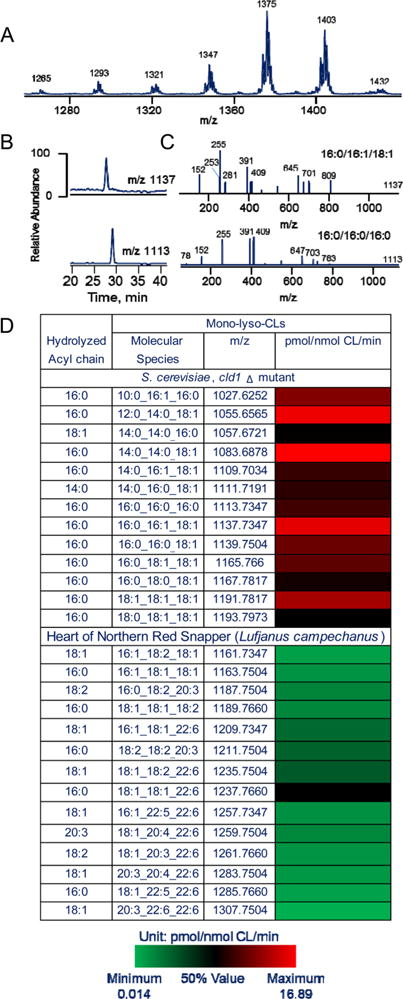
Figure 7.

Typical LC-ESI-MS spectrum of CL isolated from cld1Δ mutants (A), LC-MS profiles (B), and MS/MS spectra (C) of MLCLs after CL hydrolysis by Cld1 and heat map of monolyso-CLs molecular species (D) after the release of fatty acids from CLs induced by Cld1 in the CLs isolated from cld1Δ mutant and from the heart of northern red snapper (Lutjanus campechanus).
