. 2017 Aug 21;6:e27679. doi: 10.7554/eLife.27679

Figure 3. Two-photon photobleaching demonstrates non-directional solute transport in brain parenchyma.

(A) (left panel) Image of 500 kDa FITC-dextran in mouse cortex visualized by 2-photon fluorescence microscopy at a depth of 60 μm. (center panels) Photobleaching of a 10 μm diameter disk immediately adjacent to a penetrating arteriole showing partial recovery of fluorescence in the bleached region 20 s after bleaching. Images are pseudocolored for intensity. (right) Kinetics of fluorescence recovery in the bleached area. (B) Kinetics of fluorescence recovery within subdomains 1–4 of the original bleached area, showing spatially homogenous recovery. (C) Time course of fluorescence measured at different positions away from a nearby arteriole demonstrates confinement of bleached molecules to the initial bleaching area. (D) Positional tracking of the bleached area during recovery (left and center panels), and displacement over time (right panel).

Figure 3.

Figure 3—figure supplement 1. Characterization of 2-photon photobleaching of 500 kDa FITC-dextran.

Figure 3—figure supplement 1.

(A) Recovery curves following bleaching in disks from 5 to 80 μm in diameter measured in vitro. (B) Relationship between bleached disk size and recovery time constant for measurements done as in A. (C) Time constant of recovery following bleaching of a 40 μm diameter disk in vitro and in vivo.
Figure 3—figure supplement 2. Rapid solute transport in the paravascular space.

Figure 3—figure supplement 2.

(A) Images of 500 kDa FITC-dextran in paravascular space before and following photobleaching show rapid recovery from deep bleaching. (B) Time course of fluorescence recovery following bleaching shown in A.
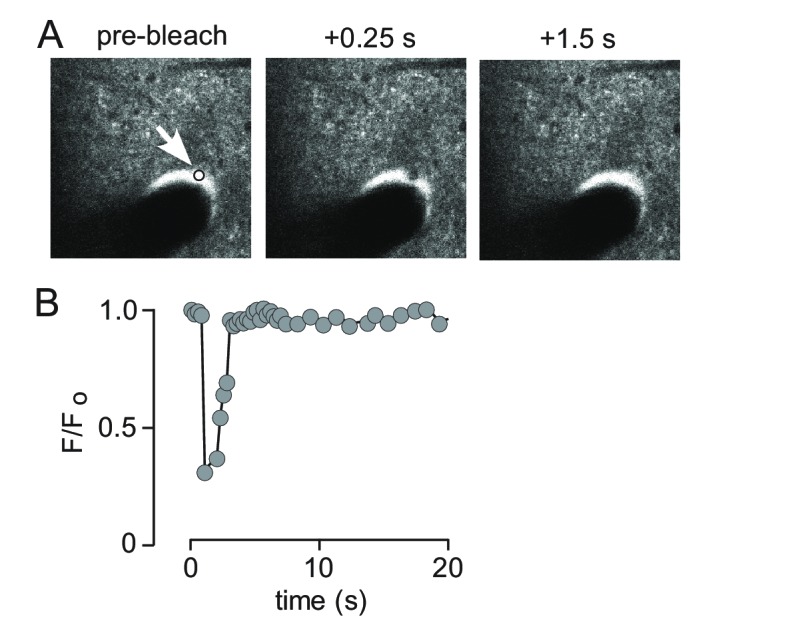
Figure 3—figure supplement 3. Quantification of convection verses diffusion from 2-photon photobleaching data.

Figure 3—figure supplement 3.

(A). (left) Schematic of angle-segmened fluorescence recovery. (center) Schematic of fluorescence recovery profiles for four angle segments (each 90 degrees) from the center of mass of the bleached spot. (right) Angular average of fluorescence recovery by simulated convection generated by moving the experimentally recorded images at 0.5 μm/s. (B) (left) Schematic showing expected effect of convection on fluorescence in analysis regions along the direction of flow. (center) Simulated results in the presence of pure diffusion or convection at 0.5 μm/s. (right) Convection was simulated by moving the experimentally recorded images at 0.5 μm/s in the analysis regions. (C) (left) Detected center position of bleached area measured at 5 s intervals in the presence of simulated convection (0.5 μm/s). (right) Displacement of the bleached region in the presence of simulated convection (0, 0.2, 0.5 and 1 μm/s).