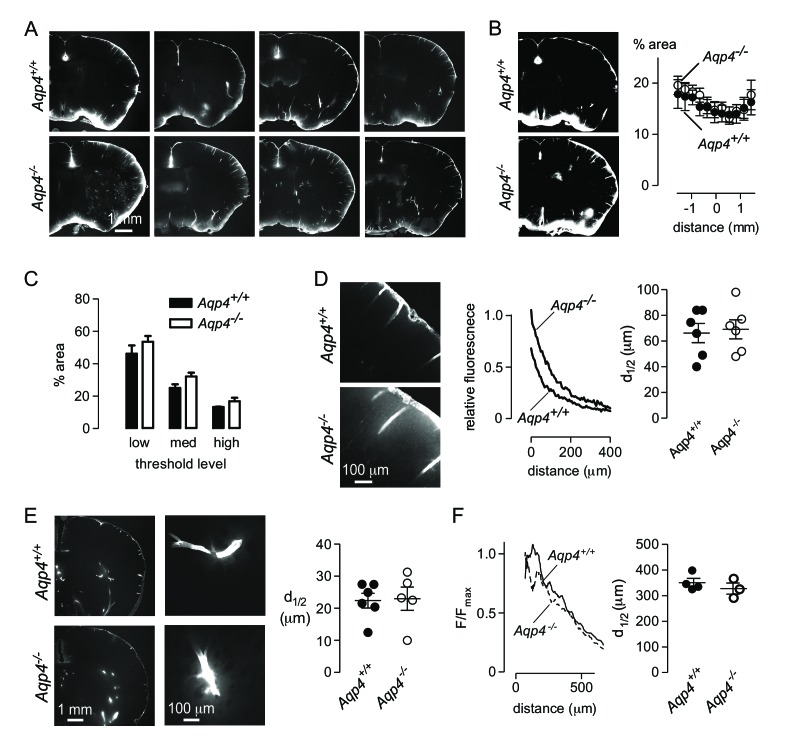
Figure 5. Aqp4 gene deletion does not impair penetration of fluorescent ovalbumin into brain parenchyma from the subarachnoid space.
(A) Fluorescence images of brain sections from Aqp4+/+ and Aqp4-/- mice that were fixed 30 min after injection of Alexa647-labelled ovalbumin into the cisterna magna, showing fluorescence in the paravascular spaces and parenchyma near the brain surface. (B) (left) Thresholding approach used to determine the fraction of the section containing labelled ovalbumin. (right) Fractional area of ovalbumin uptake for individual brain sections at indicated distances from the bregma (mean ± S.E.M., six mice per genotype, p=0.72 by two-way ANOVA). (C) Choosing different threshold levels for image analysis altered the area covered by fluorescence but did not reveal genotype-specific differences. (D) (left) Higher magnification images showing penetration of solute from the brain surface into the parenchyma in Aqp4+/+ and Aqp4-/- mice. (center) Fluorescence intensity as a function of distance from the surface, for the sections shown at left. (right) Average half-penetration distance of solute into the parenchyma from the brain surface in slices from six mice per genotype (mean ± S.E.M.). (E) (left) Distribution of Alexa 647-labelled ovalbumin at 30 min after injection into rat brain. (center) Movement of ovalbumin into the parenchyma from the para-arterial spaces. (right) Average half-distance moved by dye from the paravascular spaces into the striatal parenchyma for Aqp4+/+ (n = 6) and Aqp4-/- (n = 5) rats (mean ± S.E.M.). (F) Distribution of Aβ1-40 following interparenchymal injection in Aqp4+/+ and Aqp4-/- mice. (Left) Average fluorescence intensity of HiLyte-647 Aβ1-40 as a function of radial distance from the injection site. (Right) Distance at which fluorescence decreases to 50% of its value at the center of the injection site (4 Aqp4+/+ mice; 3 Aqp4-/- mice; p=0.42 by t-test).


