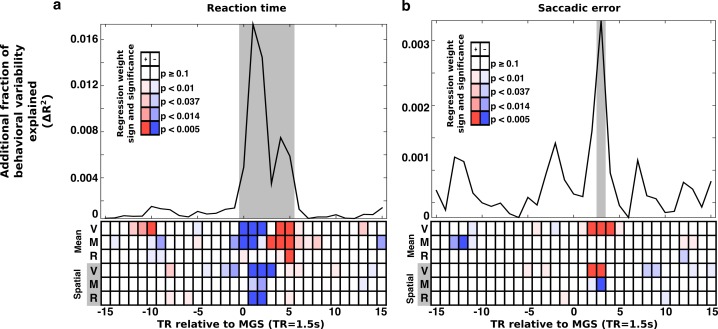
Figure 4. Trial-wise relationship between brain state expression and behavior.
Trial-to-trial brain state variability is associated with (a) reaction time and (b) saccade error. For all trials, snippets of the time course of brain state variability, centered on the TR containing the MGS are extracted and aligned (±15 TRs). At each TR relative to the saccade a regression model estimated the relationship between trial-to-trial behavioral performance and variability in the amplitude of expression of the canonical brain state components. The top panels depict the additional fraction of behavioral variability (compared to a null model) accounted for by including brain state measurements from each TR relative to each correct MGS. Highlighted gray intervals represent TRs where the full models provided a better fit than the null model (simulated likelihood ratio test with 5000 iterations; p<0.001). Each cell in the lower panels of (a) and (b) represent the p-value (darker colors are more significant) and the sign of the regression coefficient (blue, negative; red, positive) for each brain state component. Positive coefficients indicate that greater expression of a brain state component at a given time is associated with an increase in RT or SE. A negative coefficient indicates that greater expression of a brain state component is associated with a reduction in RT or SE. The top three rows of cells represent the mean brain state components (V: VME; M: maintenance; R: retrieval). The bottom three rows represent the significance of interactions between the spatial brain state component and the target hemifield.

