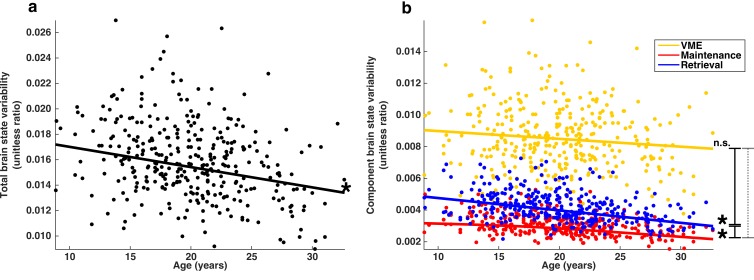
Figure 6. Developmental trajectories of brain state variability.
(a) Trajectory of total brain state variability, the ratio SSbrain/(SSbrain +SSerror) across age. A single point represents each session. (b) Depicts the developmental trajectories of the components of brain state variability: VME (yellow), maintenance (red) and retrieval (blue). Total brain state variability equal to the sum of the variability of each component. Single asterisks indicate significant individual slopes of brain state component variability; vertical lines connecting endpoints represent pairwise comparisons of slopes. Solid and dashed lines indicate a significant, and non-significant differences respectively.

