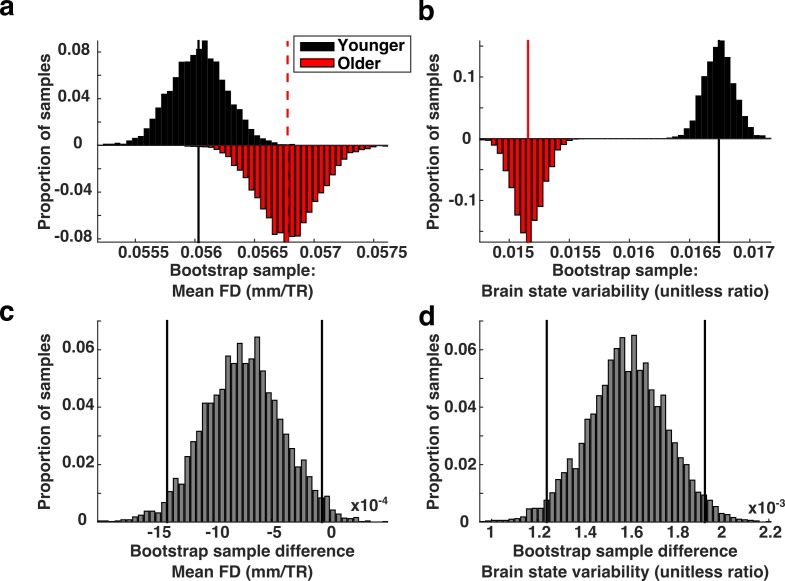
Figure 7. Brain state variability in high motion adults compared to low motion children.
(a) Biased bootstrap sample distribution of mean FD in which the older subjects (red histogram) moved more than younger subjects (black histogram). (b) The corresponding distributions of brain state variability demonstrate that brain state variability is still greater in younger subjects who moved more than adults. Vertical lines in the top two panels represent the means of the distributions. (c–d) The bootstrap differences for the corresponding distributions above. Vertical black lines indicate 95% confidence intervals.

