
FIG. 1.
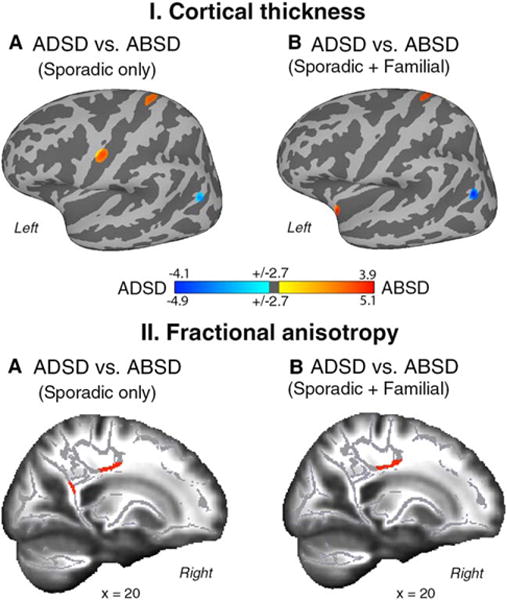
Group statistics of the comparison between ADSD and ABSD patients for cortical thickness (CT, panel I) and fractional anisotropy (FA, panel II). Regions of altered CT are superimposed on the inflated cortical surface of the MNI_305 template and thresholded at Pcorr < 0.01 with a minimum surface area of 80 mm2. TBSS results are shown on a series of sagittal slices of the subjects’ average FA maps transformed in the MNI standard brain. Maps were thresholded at Pcorr < 0.01 with a minimum cluster size of 50 voxels. The color bar represents t scores of group statistical comparisons. (A) Differences between homogeneous groups of ABSD and ADSD patients. (B) Differences between heterogeneous groups of ABSD and ADSD patients.