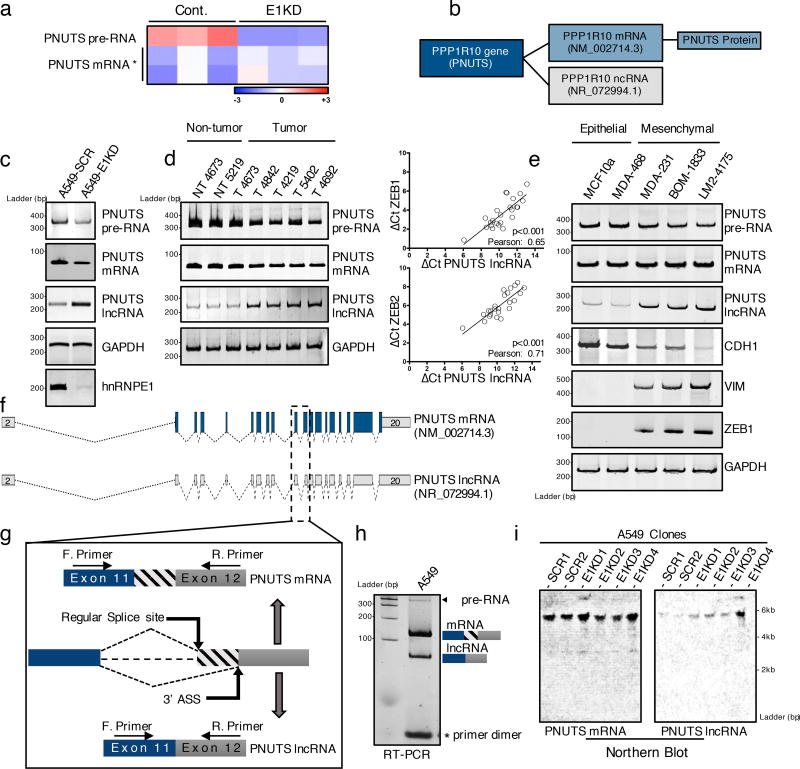
Figure 1. PNUTS alternative splicing occurs upon hnRNP E1 loss and is increased in mesenchymal tumor cells.
(a) Heat map of Affymetrix array data showing expression levels (log2 fold) of either PNUTS pre-RNA or PNUTS mRNA in control (CTRL) or hnRNP E1 knockdown (E1KD) NMuMG cells. The data were generated from triplicates samples. * Two distinct probes were used to target the spliced PNUTS RNA.
(b) NCBI database accession numbers of PNUTS mRNA and PNUTS predicted lncRNA isoform in human.
(c) Validation by RT-PCR analysis with primers specific to PNUTS isoforms of alternative PNUTS gene processing upon hnRNP E1 knockdown in human A549 cell line.
(d) (Left) PNUTS isoform expression levels analyzed by RT-PCR in human breast tumor samples (T) or non-tumor counterparts (NT). (Right) Quantitative RT-PCR analysis of lncRNA-PNUTS, ZEB-1 and ZEB-2 expression in 24 human breast tumor samples. Relative expression levels of transcripts were calculated using the ΔCt method normalizing to GAPDH. Correlations between transcript expression levels were evaluated using Pearson correlation coefficient test. (Linear regression, df=24-2, a Pearson score > 0.515 and p<0.05 was considered as significant). Source data are available in Supplementary table 2.
(e) PNUTS isoform expression screening by RT-PCR analysis in MCF10a mammary gland epithelial cells and MDA-MB-468 breast cancer epithelial cells, or in the metastasis progression model of MDA-MB-231 mesenchymal cell line (MDA-231, BOM-1833, LM2-4175). E-Cadherin (CDH1) was used as epithelial marker while vimentin (VIM) and ZEB1 were used as mesenchymal cell specific markers.
(f) Map of PNUTS isoforms acquired by sequence alignment and drawn by using fancyGene online software.
(g) Schematic representation of the alternative splicing region of the PNUTS variants (ASS: Alternative Splicing Site).
(h) RT-PCR amplification of exon11–exon12 junction encompassing the predicted alternative splicing site using intron-flanking PCR primers as indicated in (g).
(i) Northern-blot analysis of both PNUTS mRNA and lncRNA isoforms expression in control (SCR) or hnRNP E1 knockdown (E1KD) A549 cell clones.

