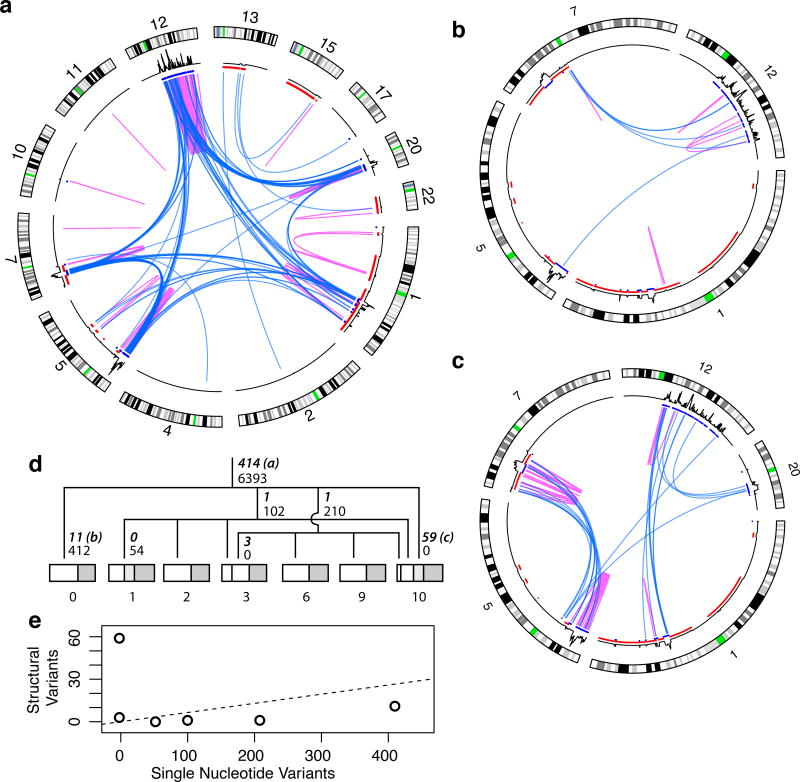
Figure 3.
Somatic genome evolution of the sarcoma. (a), Circos plots of the 414 ancestral (trunkal) events (b), events private to sample 0 and (c), events private to sample 10. Blue, interchromosomal events; magenta, intrachromosomal. Otherwise, as in 2c. (d) Lineage tree of the samples reconstructed from high-confidence somatic SNVs. Number of SNVs supporting each branch are in small font, number of breakpoints are in bold italic with circos plot panel letters indicated for plots a–c. Samples are subdivided proportionally to somatic allele frequencies to indicate subclone size. Portion corresponding to normal contribution (e.g., infiltrating lymphocytes) is in dark grey. (e) Number of SVs vs SNVs for each branch in lineage tree. The ancestral branch is shown as a dashed line indicating the rate at which SVs would accumulate relative to SNVs under a constant rate model.

