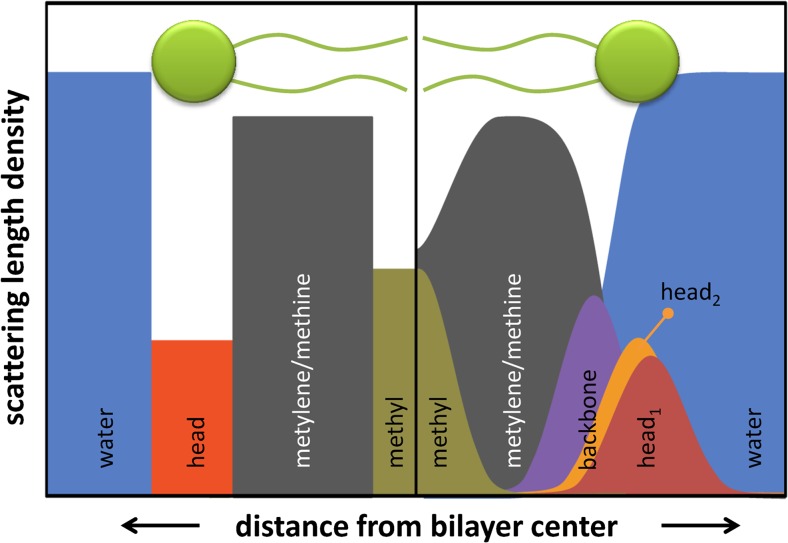
Fig. 1.
Scattering length density models with different detail for bilayer structure. The left hand side shows a slab model discriminating between the SLDs of lipid headgroup, hydrocarbon region and methyl terminus of the hydrocarbon chains. The right hand side resembles the SDP model, which considers distribution functions of Gaussian type for quasi-molecular fragments of lipid molecules. Typically additional groups, such as, e.g., the glycerol backbone or a splitting of the headgroup (into phosphate and primary alcohol groups) are considered

