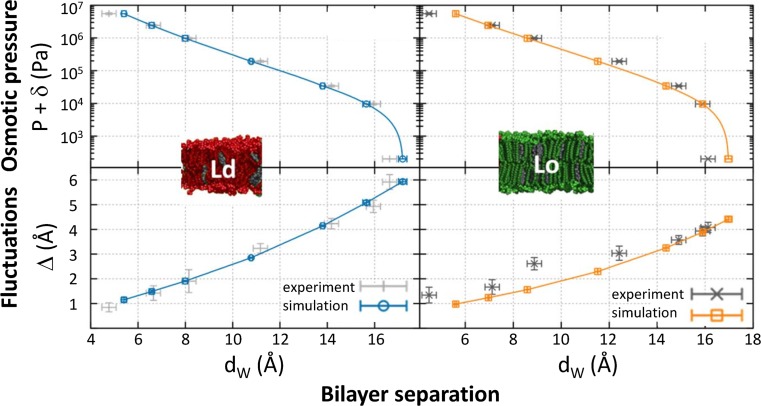
Fig. 10.
Analysis of osmotic stress data from MLVs displaying macroscopic Lo + Ld domains. Like-domains exhibit long-range positional alignment and behave independently when subjected to osmotic stress. The osmotic pressure over bilayer separation data was analyzed jointly with average membrane fluctuation amplitudes. Figure adapted from Kollmitzer et al. (2015)

