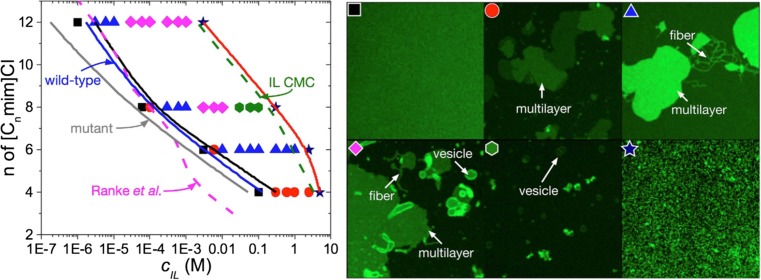
Fig. 8.
Phase diagram of [Cnmim][Cl] ionic liquid induced morphological changes to a supported α-PC bilayer taken from ref. (Yoo et al. 2016a). The EC50 toxicity line (in magenta) for IPC-cell shows a negative correlation between the toxic concentration and the RTIL cation chain length (Ranke et al. 2007a). The blue and gray lines are the predicted EC50 lines for wild-type (with cell wall) and mutant (without cell wall) strains of Chlamydomoas reinhardtii, respectively. The green line corresponds to the RTIL critical micelle concentration (CMC) of (Blesic et al. 2007). The symbols correspond to the specific morphologies as in the right image. Black square: neat bilayer; red circle: multilayer; blue triangle: multilayer and fiber/tube; pink diamond: multilayer, fiber/tube and vesicle; green hexagon: vesicle; navy star: disrupted bilayer. The solid black and red lines correspond to the onset of supported lipid bilayer disruption and the total disruption of the supported lipid bilayer respectively. Figure reproduced with permission from the publisher

