Figure 6.
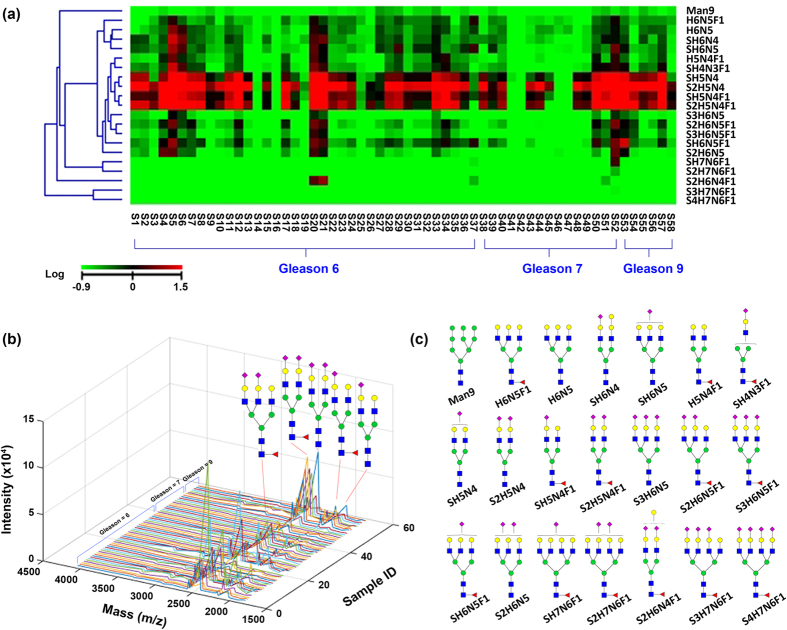
N-glycan profile of prostate cancer urines by MALDI-MS. (a) Heat map of 21 N-glycans from 58 prostate cancer urines. Three groups were characterized by AutoTip using a liquid handler, including 38 Gleason 6, 15 Gleason 7, and 6 Gleason 9. The abundance of N-glycans were normalized using mean value of all N-glycans, and heatmap was plotted after being logarithmized. (b) Pseudo-3D plot of N-glycans of 58 prostate cancer urines. The sialylated N-glycans were highly abundant in urines. (c) Cartoon structures representing the likely isoform of 22 N-glycan compositions identified in urines.

