Figure 3.
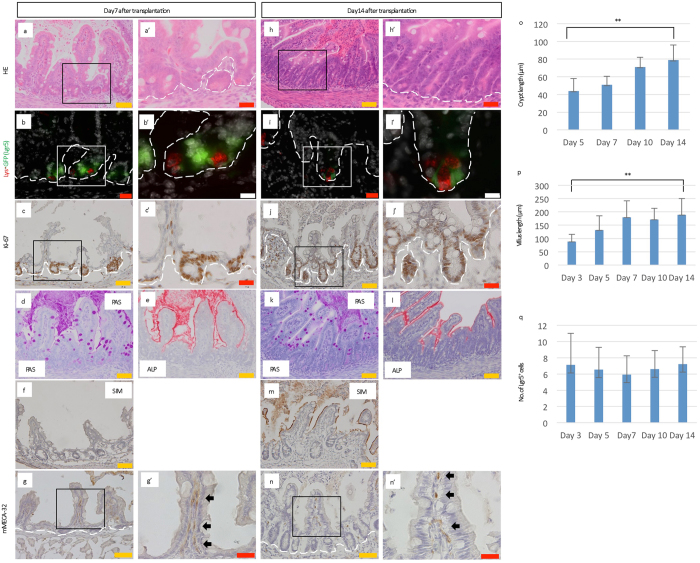
The subrenal capsule can support the development of the transplanted neonatal small intestine to complete maturation. (a,a’,h,h’) H&E staining for transplanted small intestine harvested from P0 Lgr5 EGFP-IRES-CreERT2/+ mice at the indicated days post-transplantation. (b,b’,i,i’) Immunostaining for lysozyme (red, Lys) on sections of transplanted small intestine derived from P0 Lgr5 EGFP-IRES-CreERT2/+ mice at the indicated days after transplantation (green, Lgr5). (c,c’,j,j’) Immunostaining for Ki-67 (brown), as a marker for cell proliferation, on sections of transplanted small intestine derived from P0 Lgr5 EGFP-IRES-CreERT2/+ mice at the indicated days post-transplantation. (d,k) Periodic acid-Schiff (PAS) staining for transplanted small intestine harvested from P0 Lgr5 EGFP-IRES-CreERT2/+ mice at the indicated days after transplantation. (e,l) Alkaline phosphatase staining of transplanted small intestine harvested from P0 Lgr5 EGFP-IRES-CreERT2/+ mice at the indicated days after transplantation. (f,m) Immunostaining of transplanted intestinal tissue revealing cell maturation based on sucrose-isomaltase (SIM) expression. (g,g’,n,n’) Immunostaining for mMECA-32 (brown) (g’,n’: black arrows), as a marker of vasculature ingrowth, on sections of transplanted small intestine derived from P0 Lgr5 EGFP-IRES-CreERT2/+ mice at the indicated days after transplantation. Higher magnification images (a’,b’,c’,g’,h’,i’,j’,n’) of the corresponding boxed area are shown on the right side of the respective images. White dashed lines indicate the boundary between the epithelium and lamina propria. Scale bars: orange, 50 μm; red, 20 μm; white, 10 μm. (o) The crypt length of transplanted small intestine harvested from P0 Lgr5 EGFP-IRES-CreERT2/+ mice at the indicated days after transplantation. Error bars indicate standard deviation. **p < 0.001. D; Days after transplantation. The numbers of crypts analyzed were as follows: D5; n = 62 in 10 transplants, D7; n = 47 in 8 transplants, D10; n = 50 in 7 transplants, and D14; n = 57 in 11 transplants derived from 4 mice (D5), 2 mice (D7), 2 mice (D10), and 3 mice (D14), respectively. (p) The villus length of transplanted small intestine harvested from P0 Lgr5 EGFP-IRES-CreERT2/+ mice at the indicated days after transplantation. Error bars indicate standard deviation. **p < 0.001. D; Days after transplantation. The number of villi analyzed were as follows: D3; n = 48 in 8 transplants, D5; n = 66 in 10 transplants, D7; n = 44 in 8 transplants, D10; n = 50 in 7 transplants, D14; n = 49 in 11 transplants derived from 2 mice (D3), 4 mice (D5), 2 mice (D7), 2 mice (D10), and 3 mice (D14), respectively. (q) The number of Lgr5-EGFP+ cells per inter-villus region or crypt. Error bars indicate standard deviation. D; Days after transplantation. The numbers of crypts analyzed were as follows: D3; n = 55 in 8 transplants, D5; n = 40 in 10 transplants, D7; n = 41 in 8 transplants, D10; n = 45 in 7 transplants, and D14; n = 40 in 11 transplants derived from 2 mice (D3), 4 mice (D5), 2 mice (D7), 2 mice (D10), and 3 mice (D14), respectively.

