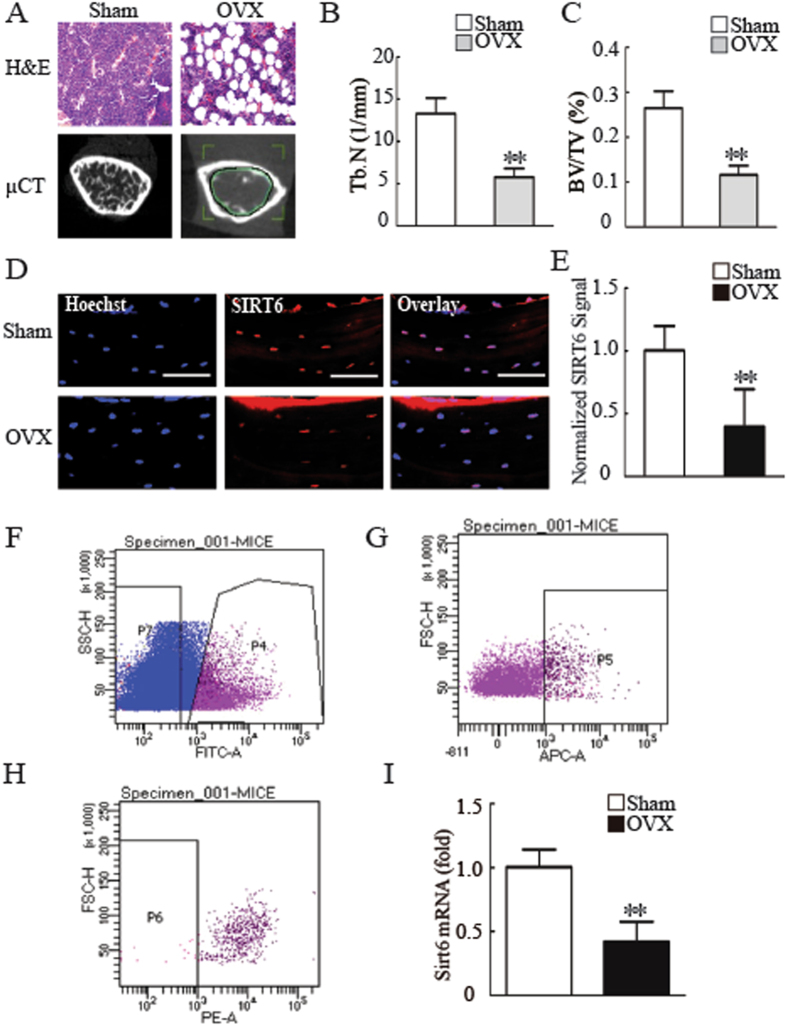
Figure 5.
SIRT6 is a potential target for osteoporosis treatment. (A) Micro CT and H&E analysis exhibited bone loss in OVX mice compared with sham mice. Scale bar for micro CT and H&E represents 1 mm and 20 µm, respectively. (B) OVX mice showed impaired trabecular number compared with sham mice. (C) OVX mice showed reduced bone volume compared with sham mice. (D) SIRT6 was decreased in bone sections from OVX mice compared with sham mice, as determined by histology and immunofluorescence staining. Scale bar represents 50 µm. (E) Quantification of normalized SIRT6 signals in (D). (F–H) Flow cytometry analysis of PDGFR- α+Sca-1+CD45−TER119− cells. (I) Compared to sham mice, Sirt6 expression was dereased in primary MSCs from OVX mice, as determined by RT-qPCR. All data are shown as the mean ± SD, n = 3. **P < 0.01.

