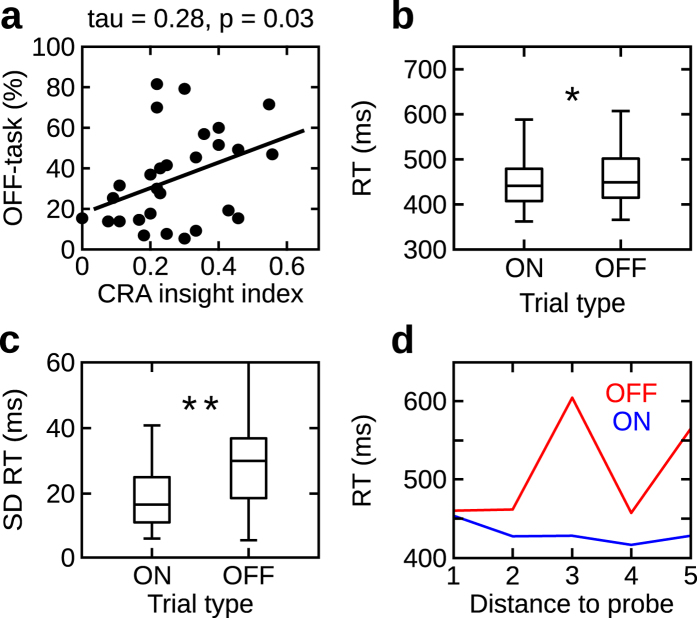
Figure 2.
Results experiment 1. (a) Correlation between the number of mind wandering instances and creative insight index (N = 28). (b) Box plot of reaction times separately for on- and off-task states (no mind wandering and mind wandering, respectively). The central line and edges reflect median and 25th, 75th percentiles, respectively. The whiskers extend to the most extreme data points. (c) Box plot of standard deviation of reaction times separately for on- and off-task (no mind wandering and mind wandering, respectively) intervals. The central line and edges reflect median and 25th, 75th percentiles, respectively. The whiskers extend to the most extreme data points. (d) Example of single participant data illustrating the effect of increased reaction time dispersion during mind wandering. Reaction times for five consecutive responses preceding the experience sampling probe plotted separately for no mind wandering (on-task; blue) and mind wandering (off-task; red) responses to the experience sampling probe. *Indicates p < 0.05; **indicates p < 0.01.

