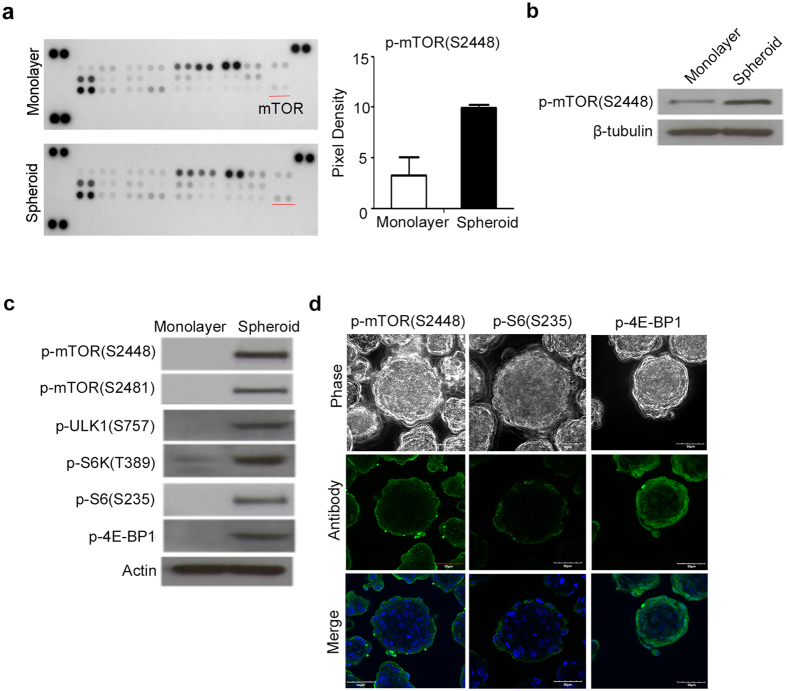
Figure 3.
Activation of the mTOR signaling pathway during spheroid formation on chitosan film. (a, Left panel) After 48 hr of seeding on monolayer or with chitosan coating (Spheroid), cell lysates were analyzed using the Human Phospho-MAPK Array kit. (a, Right panel) the spots of phospho-mTOR (S2448) were analyzed by an image analysis system. (b and c) Whole-cell lysates were analyzed by western blotting with specific antibodies against indicated molecules. β-tubulin and actin were used as the loading control. (d) Immunostaining of p-mTOR (S2448), p-S6 (S235), and p-4EBP1 in 3D spheres. DAPI merged images are shown in the low panel. Scale bar = 50 μM. The results are expressed as the mean ± standard deviation of three independent experiments, which is representative of MSCs from two individuals. **p < 0.01 compared with monolayer cells.

