
Figure 2.
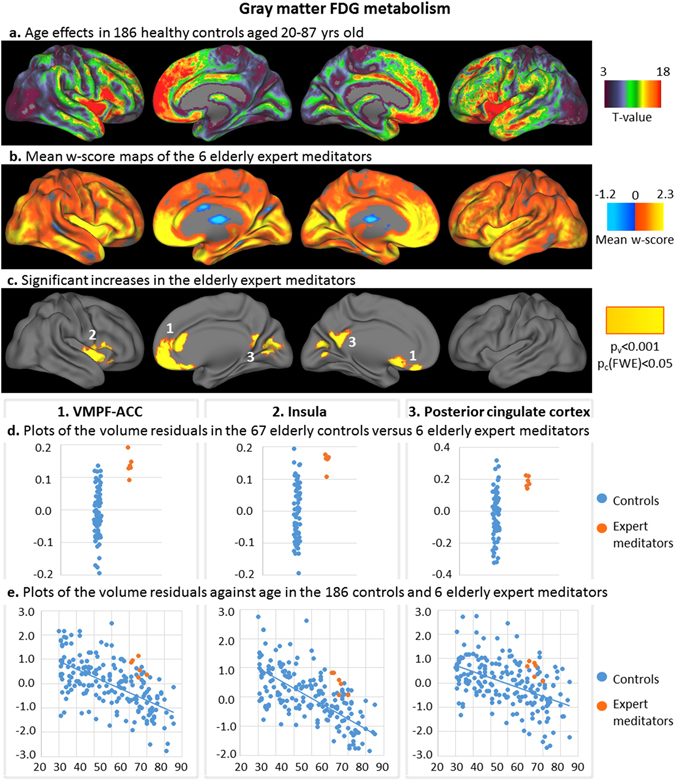
Results of the analyses on gray matter glucose metabolism. T-values of the voxelwise regression analysis between the z-score maps of the 186 controls (corrected for education) and age were superimposed on brain surface views (a). Mean w-score values of the expert meditators corrected for age and education and using the elderly control group as the reference (b), and clusters of interest showing significantly higher values in the expert meditators (voxel-level p < 0.001 and FWE-corrected cluster-level p < 0.05) (c) were superimposed on brain surface views. Glucose metabolism residuals in the 3 clusters of interest were plotted in the elderly expert meditators (orange) and in the controls (blue) of the elderly control group (d; residuals are corrected for age and education); of the entire control group against age (e; residuals are corrected for education). VMPF-ACC: ventromedial prefrontal and anterior cingulate cortex; TP: temporo-parietal.