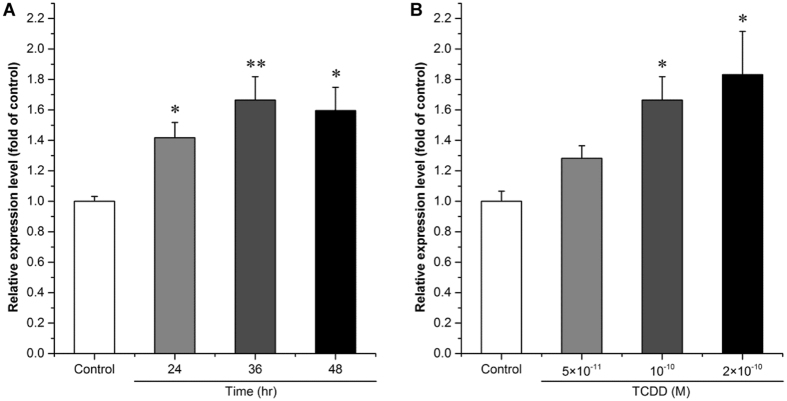
Figure 2.
Effect of TCDD on the expression of hsa-miR-608 in cultured SK-N-SH cells. SK-N-SH cells were treated with 10−10 M TCDD or 0.1% DMSO for 24 hr, 36 hr or 48 hr (A), or with 5 × 10⁻¹¹, 10−10, or 2 × 10⁻¹⁰ M TCDD or 0.1% DMSO for 36 hr (B). Total miRs was extracted for determination of the expression level of hsa-miR-608. Quantitative PCR analyses were performed as mentioned in M & M. U6 rRNA was used as an internal control. Values were expressed as mean ± S.E. (n = 3) and each independent sample was detected in triplicate. Statistical analysis was done by t-test (A) or by one-way ANOVA with Bonferroni test (B), and *p < 0.05, **p < 0.01, compared with control (DMSO treated cells).

