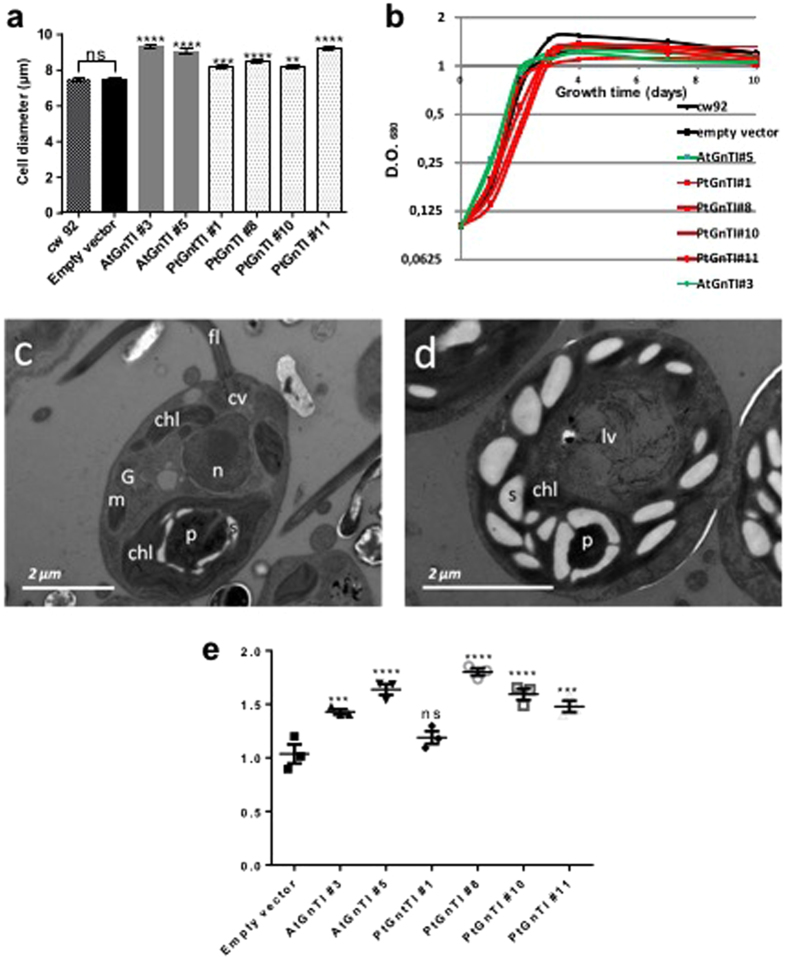
Figure 2.
(a) Measurement of the cell diameters of C. reinhardtii cells expressing AtGnTI or PtGnTI as compared to the cw92 cells and cells transformed with an empty vector (Kruskal-Wallis test with n > 200 and p-value fixed at 0.05; stars indicate the significant level of the test). (b) Growth rate of cw92 and transformed cell lines grown in TAP medium. (c,d) Ultrastructure of cw92 cells (c) and transformed cell line AtGnTI#3 (d) by Transmission Electron Microscopy (TEM). chl: chloroplast, fl: flagella, G: Golgi apparatus, m: mitochondrion, n: nucleus, P: pyrenoid, s: starch granules, cv: contractile vacuoles, lv: large vesicles. (e) ROS levels in transformed cell lines determined through the oxidation measurement of CMH spin probe by electron paramagnetic resonance spectroscopy. The ROS level (arbitrary units/12 × 104 cells hour−1) in each transformed cell line was normalized against ROS level measured in cw92 cells. After normalization, a statistical test was performed between GnTI expressing cell lines and cells transformed with the empty vector using Ordinary One-Way ANOVA with n = 3 and p-value fixed at 0.05.

