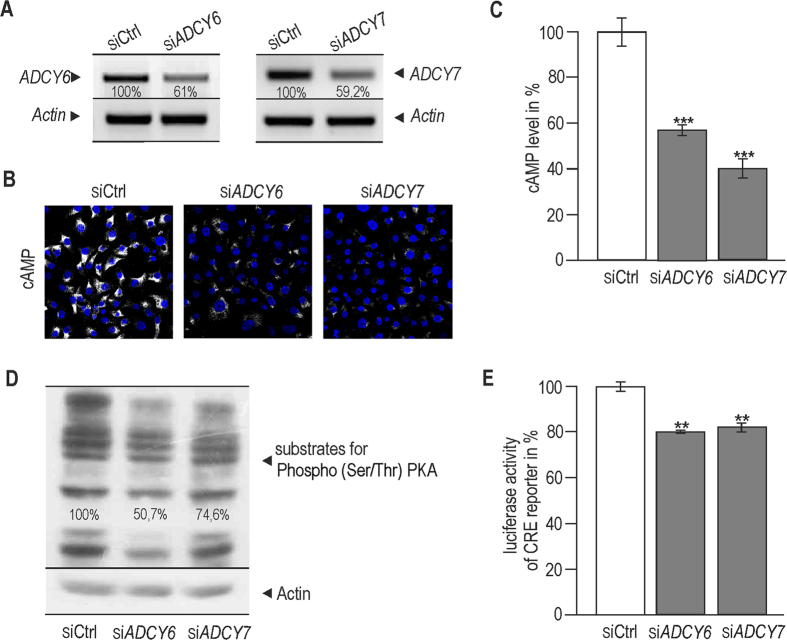
Figure 4.
Suppression of ADCY6 and ADCY7 leads to decrease of cAMP level and reduced cAMP/PKA signalling. RKO cells were transiently transfected with specific ADCY6 and ADCY7 siRNA. The following day transfected cells were placed in the hypoxia station and cultured in hypoxic conditions (2% O2) for 24 h. At 48 h post transfection, samples were verified by semiquantitative PCR (A). The bands were quantified in ImageJ and related to control samples (set as 100%). All results were normalized to actin (A). After suppression of ADCY6 and ADCY7 a significantly decreased level of cAMP was observed in hypoxic RKO cells using immunofluorescent staining (B). cAMP is shown as a greyscale signal where a shift from grey to white represents an increase in the signal intensity. Images were acquired at LSM Meta 510 confocal microscope (Zeiss) at the same settings. Graph (C) shows a change in the average intensity of cAMP signal per pixel (measured in levels of greyscale) in silenced samples compared to controls. At least 200 cells were analyzed for each sample. Results were calculated from three independent biological experiments and expressed as cAMP level in % of the control samples levels set as 100%. Statistical significance of differences between silenced and control samples was assessed using Student’s t-test (*P < 0.05, **P < 0.01, ***P < 0.001). Moreover, silencing of ADCY6 or ADCY7 led to a decreased level of substrates for Phospho (Ser/Thr) PKA analyzed by Western blotting (D). All bands of substrates for Phospho (Ser/Thr) PKA shown in Western blot were quantified in ImageJ, the control sample was set as 100% and results were normalized to actin. (E) The effect of these isoforms on cAMP signalling was confirmed by a significant reduction of CRE reporter activity in samples with silenced ADCY6 and ADCY7, measured by dual luciferase assay (Promega). Graph shows the mean of two independent experiments, each performed in quadruplicates. Results showed in A,B and D give representative images from three independent biological experiments.

