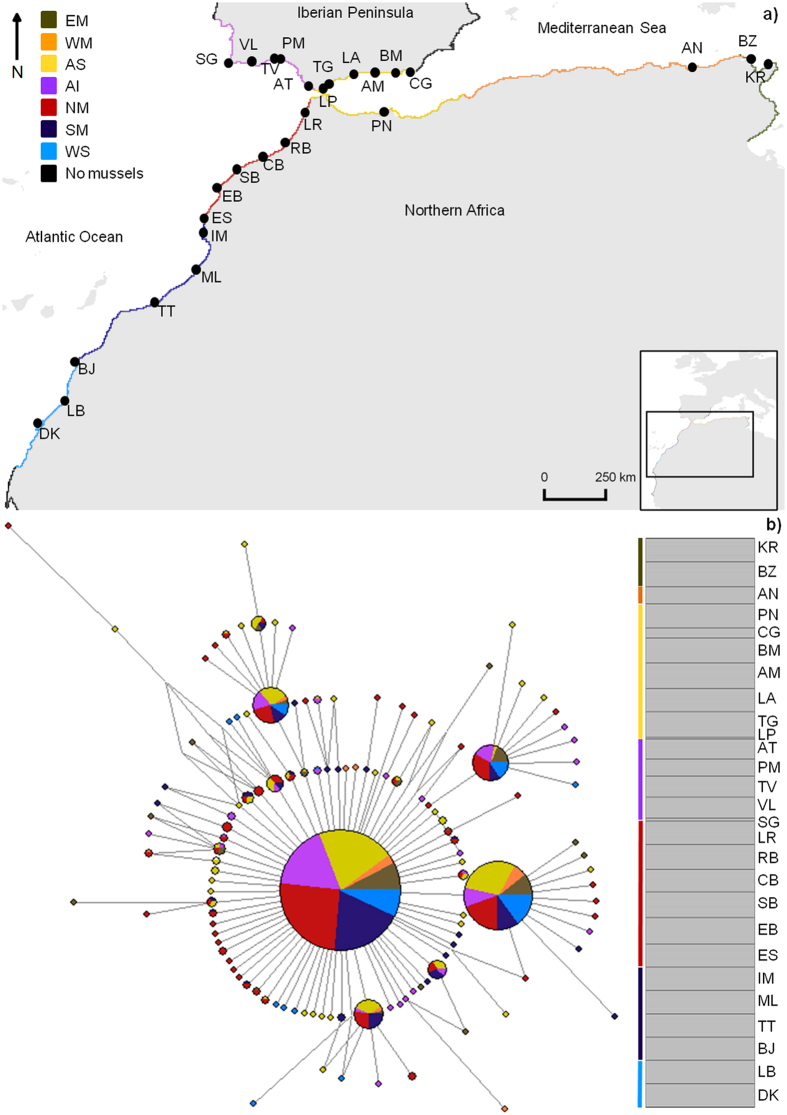
Figure 2.
Genetic structure of P. perna across northeastern Atlantic and Mediterranean shores. (a) Oceanographic regions based on dispersal potential simulation of P. perna. Colours along the shore depict distinct oceanographic regions. EM, Eastern Mediterranean; WM, Western Mediterranean; AS, Alboran Sea; AI, Atlantic Iberia; NM, Northwestern Morocco; SM, Southern Morocco; WS, Western Sahara; “No mussels” represents areas where the species is either not present (Atlantic central Iberia and northwards; southeastern Iberia and northeastwards) or it was not sampled (southernmost coast of the northern African region). Black solid circles represent sampling locations as in Supplementary Table S6. The map was created using the open source software QGIS 2.12.3 (http://www.qgis.org/). (b) Median-joining haplotype network of Cox1 gene (left) and bayesian analysis summary plot (each bar represents one individual) obtained from STRUCTURE i.e. K = 1 (right). Circle size is proportional to haplotype frequency. Colours indicate the group origin of a haplotype. Grey line represents the proportion of mutational steps. Coloured bars depict expected genetic clusters.

