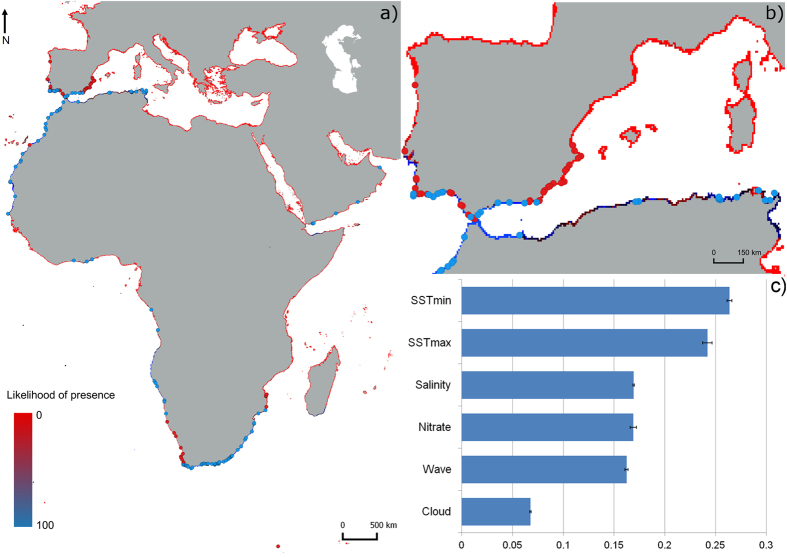
Figure 3.
Predicted native distribution for the brown mussel P. perna derived by averaging an ensemble of presence-absence algorithms. (a) overall distribution, (b) P. perna distribution along the expanding front in the Northern Hemisphere, (c) Mean scores of the relative importance of the environmental variables obtained from the ensemble. Blue and red dots represent presence and absence data, respectively, obtained from field surveys and records in the literature (see Supplementary Table S7). The map was created using the open source software QGIS 2.12.3 (http://www.qgis.org/).

