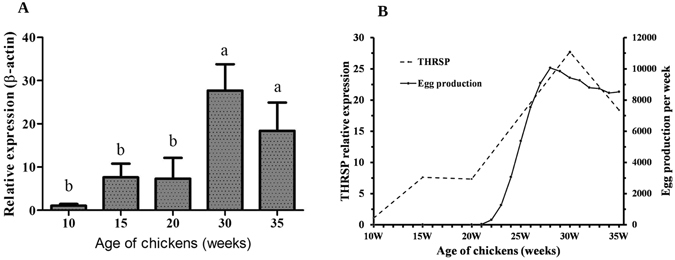
Figure 2.

Expression patterns of THRSP in chicken livers and egg production curve analysis. (A) Expression patterns of THRSP in livers of chickens at different developmental stages. The mRNA levels of the THRSP gene were normalized to mRNA levels of β-actin in livers of chickens of different ages. Each data point represents the mean ± SD of 6 chickens (n = 6). The same letters are not significantly different, whereas different letters are significantly different. (B) Comparison between the expression curve of THRSP mRNA and the egg production curve of the Lushi green-shelled-egg chickens. Each point in the egg production curve represents the cumulative egg production of 2000 chickens in one week.
