Figure 3.
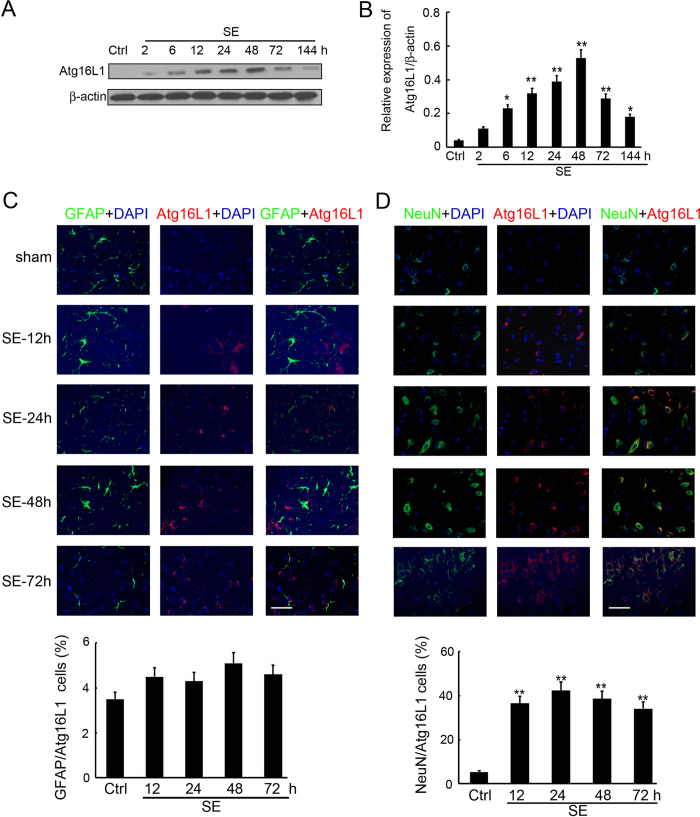
Expression and distribution of Atg16L1 after SE. (A) Western blotting analysis of Atg16L1 expression in the hippocampus of SE rats. Equal levels of protein samples (20 μg) were loaded, and β-actin served as a loading control. The relative optical density (Atg16L1/β-actin) were analyzed and represented as the mean ± SD (n = 3; **p < 0.01, compared with the ctrl group). (B) The cell type specificity of Atg16L1 was performed with double fluorescent immunolabeling (TRITC-labeled, red), accompanied with the astrocyte-specific marker GFAP (FITC-labeled, green). The nucleus was stained by DAPI (blue). Scale bar = 50 μm. The percent of GFAP and Atg16L1 positive cells was analyzed (n = 5; ns, no significant difference compared with the ctrl group). (C) The cell type specificity of Atg16L1 was performed with double fluorescent immunolabeling (TRITC-labeled, red), accompanied with the GFAP (FITC-labeled, green). The nucleus was stained by DAPI (blue). Scale bar = 50 μm. The percent of GFAP and Atg16L1 positive cells was analyzed (n = 5; **p < 0.01, compared with the ctrl group). (D) The cell type specificity of Atg16L1 was performed with double fluorescent immunolabeling (TRITC-labeled, red), accompanied with the neuron-specific marker NeuN (FITC-labeled, green). The nucleus was stained by DAPI (blue). Scale bar = 50 μm. The percent of NeuN and Atg16L1 positive cells was analyzed (n = 5; **p < 0.01, compared with the ctrl group).

