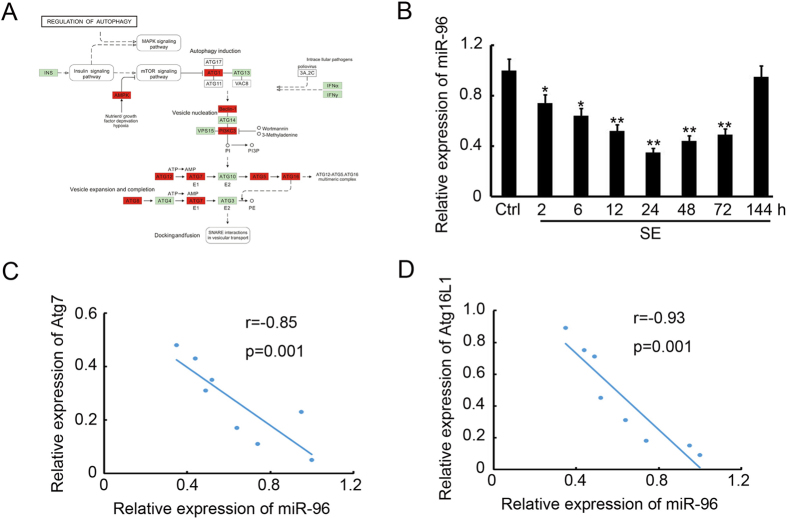
Figure 4.
Downregulation of autophagy-related miR-96 in the hippocampus of SE rats. (A) The KEGG analysis of autophagy-related genes targeted by the down-regulated miRNAs. (B) The relative expression of miR-96 in the hippocampus at different time points after SE (n = 3; **p < 0.01, compared with the ctrl group). (C) The Pearson analysis of the correlation between miR-96 and Atg7 (r = −0.85, p = 0.001). (D) The Pearson analysis of the correlation between miR-96 and Atg16L1 (r = −0.93, p = 0.001).

