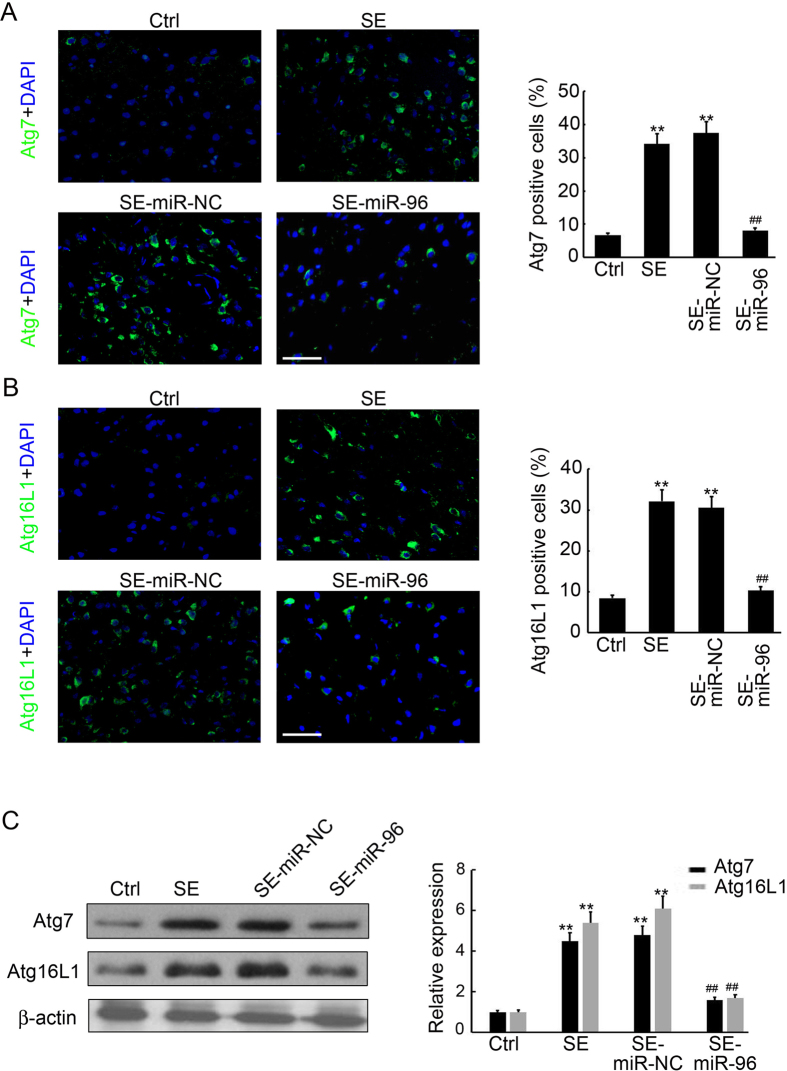
Figure 6.
miR-96 inhibits hippocampus Atg7 and Atg16L1 expression in SE rats. (A) The cell type specificity of Atg7 was performed with fluorescent immunolabeling (FITC-labeled, green). The nucleus was stained by DAPI (blue). Scale bar = 50 μm. The percent of Atg7 positive cells was analyzed (n = 5; **p < 0.01, compared with the ctrl group; ##p < 0.01, compared with the SE-miR-NC group). (B) The cell type specificity of Atg16L1 was performed with fluorescent immunolabeling (FITC-labeled, green). The nucleus was stained by DAPI (blue). Scale bar = 50 μm. The percent of Atg16L1 positive cells was analyzed (n = 5; **p < 0.01, compared with the ctrl group; ##p < 0.01, compared with the SE-miR-NC group). (C) Western blotting analysis of Atg7 and Atg16L1 expression in the hippocampus of SE rats. Equal levels of protein samples (20 μg) were loaded, andβ-actin served as a loading control. The relative optical density were analyzed and represented as the mean ± SD (n = 3; **p < 0.01, compared with the ctrl group; ##p < 0.01, compared with the SE-miR-NC group).

