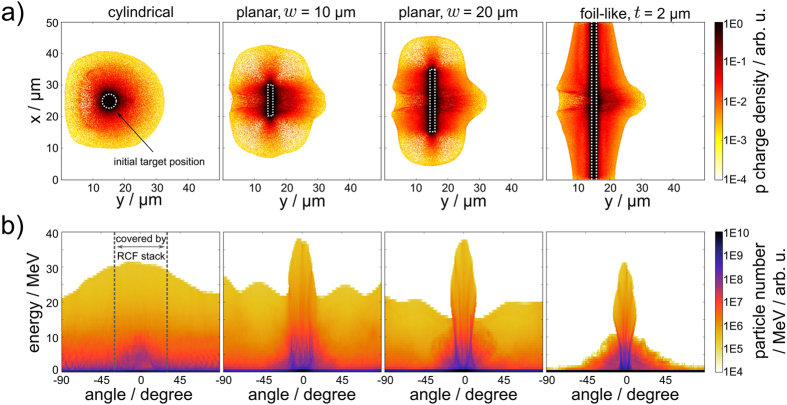
Figure 5.
Simulation results, 260 fs after the main laser peak interacted with the target front surface: (a) Proton charge density for four different hydrogen target shapes (5 μm circular, 10 μm × 2 μm, 20 μm × 2 μm, infinite with 2 μm thickness). The laser irradiates the target from the left side. Dashed white line indicates initial target position. (b) Rear side proton emission angle distribution corresponding to the target shapes in (a). The angular range covered by our RCF stacks is marked by gray dashed lines in the left-most geometry case.

