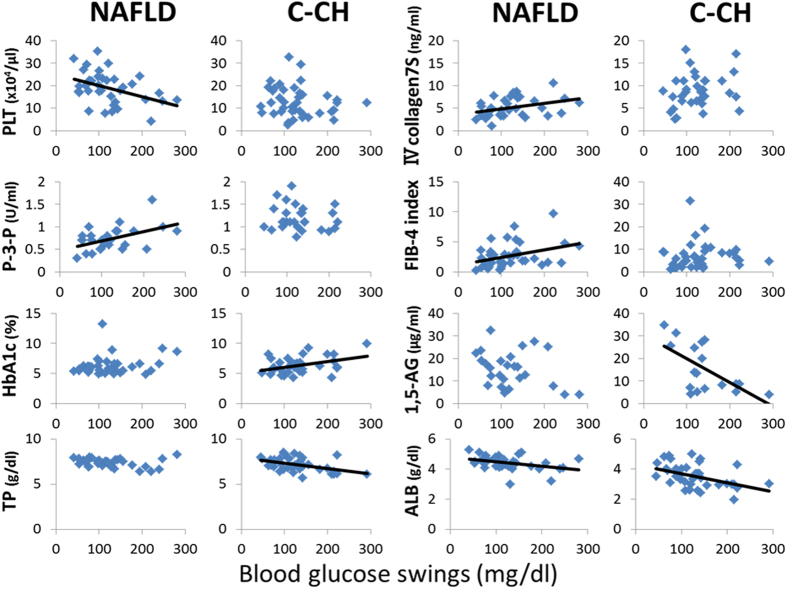
Figure 3.
Relationship between BGS and various parameters in patients with NAFLD and C-CH. BGS were correlated with ALB (r = −0.3709, P < 0.05) and fibrosis markers such as the PLT count (r = −0.4114, P < 0.05), type IV collagen 7S (r = 0.3556, P < 0.05), P-3-P (r = 0.4796, P < 0.05), and the FIB-4 index (r = 0.3510, P < 0.05) in patients with NAFLD (n = 37) and with TP (r = −0.4574, P < 0.005), ALB (r = −0.4341, P < 0.01), HbA1c (r = 0.3963, P < 0.05), and 1,5-AG (r = −0.6193, P < 0.01) but not fibrosis markers in patients with C-CH (n = 40).

