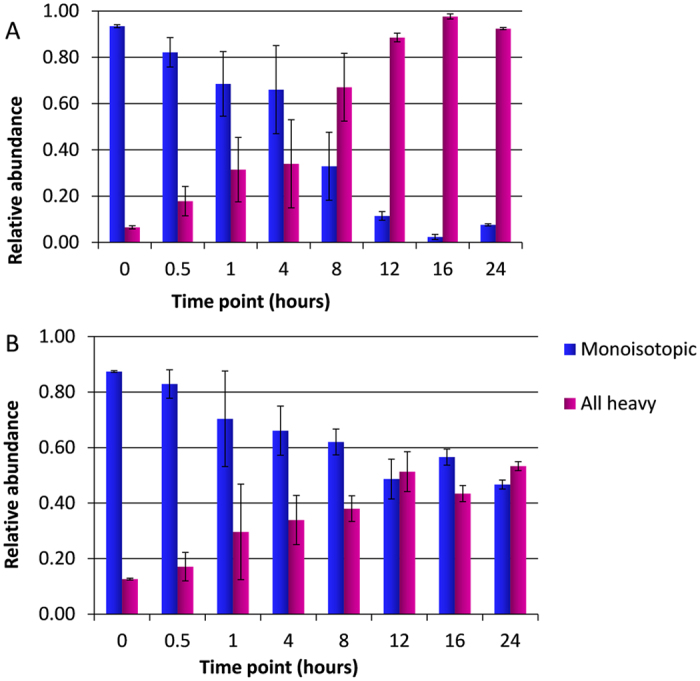
Figure 6.

Acetyl-CoA Metabolic Labeling. (A) Acetyl-CoA extracted from HeLa cells grown in 13C-glucose. The relative abundance of the monoisotopic and heavy labeled peaks of acetyl-coA at each time point is plotted. The relative abundance is calculated from two replicates, with the standard deviation indicated. (B) Acetyl-CoA extracted from HeLa cells grown in D3-acetate. The relative abundance of the monoisotopic and heavy labeled peaks of acetyl-coA at each time point is plotted. The relative abundance is calculated from two replicates, with the standard deviation indicated.
