Figure 3.
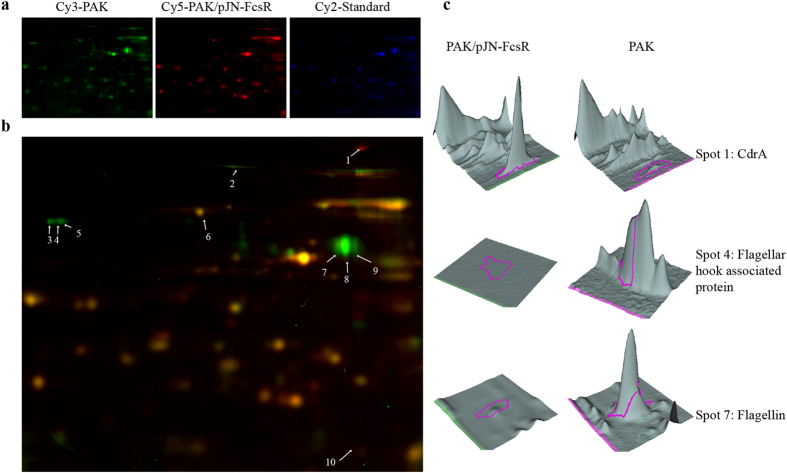
Comparative analysis of exoproteomes of PAK and PAK/pJN-FcsR by 2D DIGE. (a) Multiple images for one DIGE gel showing spot profiles for PAK (Cy3 labeled, green), PAK/pJN-FcsR (Cy5 labeled, red) and internal standard (Cy2 labeled, blue). (b) Overlay image of PAK (green) and PAK/pJN-FcsR (red) channels. Differential spots between strains (considering all four DIGE gels, p-values ≤ 0.05 and fold change ≥ 25%) are indicated and were further identified by MS analysis. Protein identities, fold changes and p values are listed in Supplementary Table S4. (c) 3D view of selected spots with significant normalized abundance fold changes: spot 1 CdrA (fold change 4.1) spot 4 flagellar hook-associated protein (fold change 11.2) and spot 7 flagellin (fold change 15.2).

