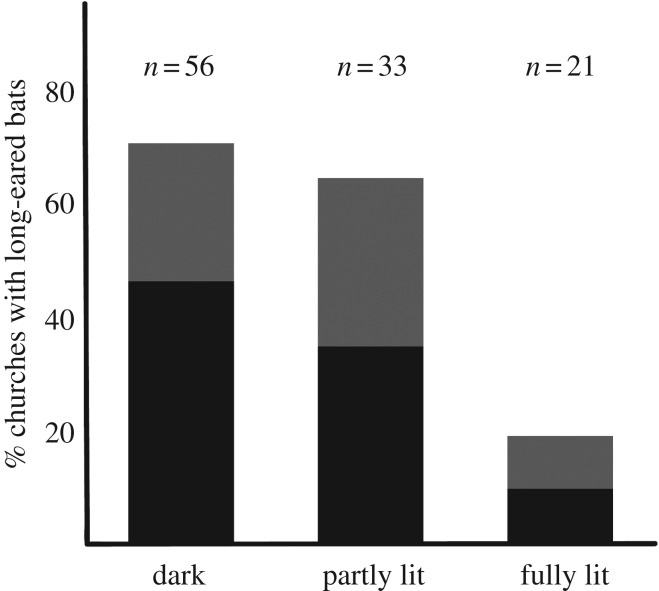
Figure 2.
Result of the 2016 survey (N = 110 churches). The bars show the frequency of occurrence of long-eared bats or their remains in relation to the amount of flood-lighting on the church walls. The churches were either dark (unlit), partly lit or fully lit (lit from all directions). Black represents churches where colonies were actually observed.

