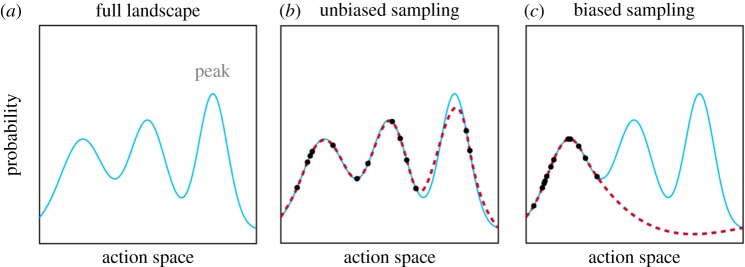
Figure 1.
Exploring the landscape of possible actions. (a) The plot shows the probability distribution over the goodness of possible actions. The peak indicates the best action. (b) A rough estimate of the probability distribution can be made by drawing samples. (c) If the sampling is biased, then the estimate of the probability distribution may not reflect the true one. To create the sample-based distributions, we drew samples from the true probability distribution (N = 14) in a uniform manner (b) or from a sub-part (c), and then applied a smooth function. We sampled the height of the true probability distribution, akin to remembering how good an action was or asking a friend for their advice about which action to take.

