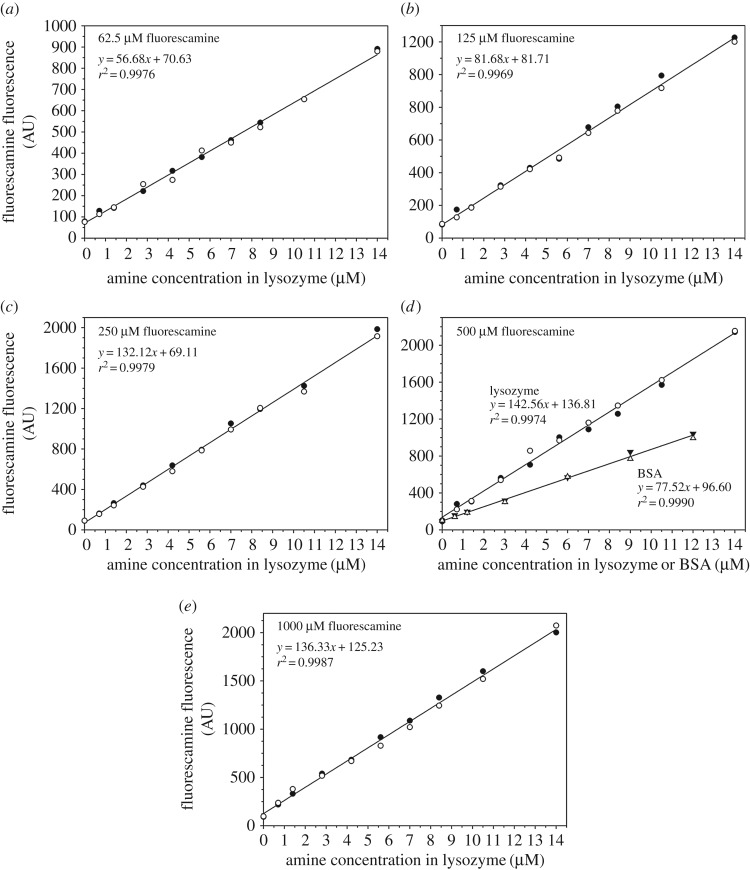
Figure 1.
Standard curves for the fluorescamine method. Hen egg white lysozyme at nine concentrations (0.1, 0.2, 0.4, 0.6, 0.8, 1.0, 1.2, 1.5, 2.0 µM) was used to derive the standard curves. Concentrations of fluorescamine are at 62.5 µM (a), 125 µM (b), 250 µM (c), 500 µM (d) and 1000 µM (e). For comparison, BSA was also used for the 500 µM fluorescamine measurements (d). Two independent measurements were performed. Lines are linear fits to the data.

