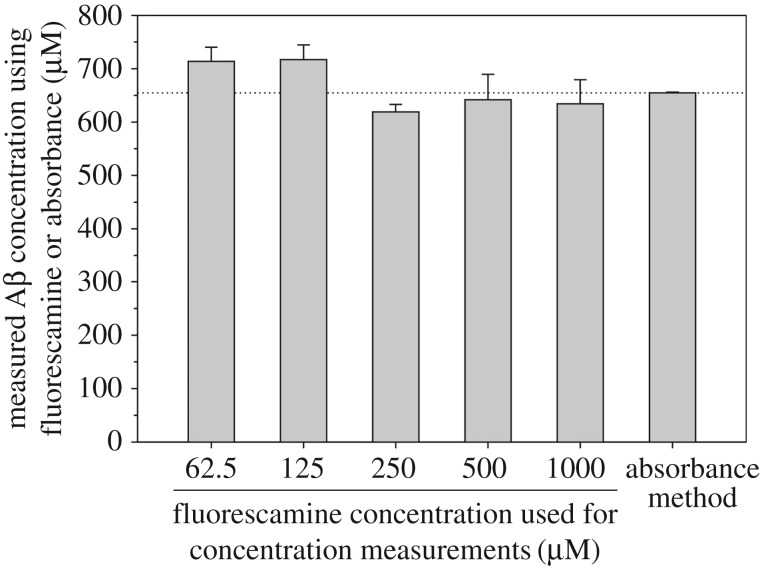
Figure 2.
Comparison of Aβ40 concentrations determined using the fluorescamine method with absorbance at 280 nm. The dotted horizontal line is drawn to aid visual comparison. Error bars are standard deviations of three independent measurements. For the fluorescamine data, the error includes fluctuations in both dilution and instrument. For the absorbance data, the error bar reflects only instrument error and is thus extremely small as the sample was measured without dilution.

