Figure 4.
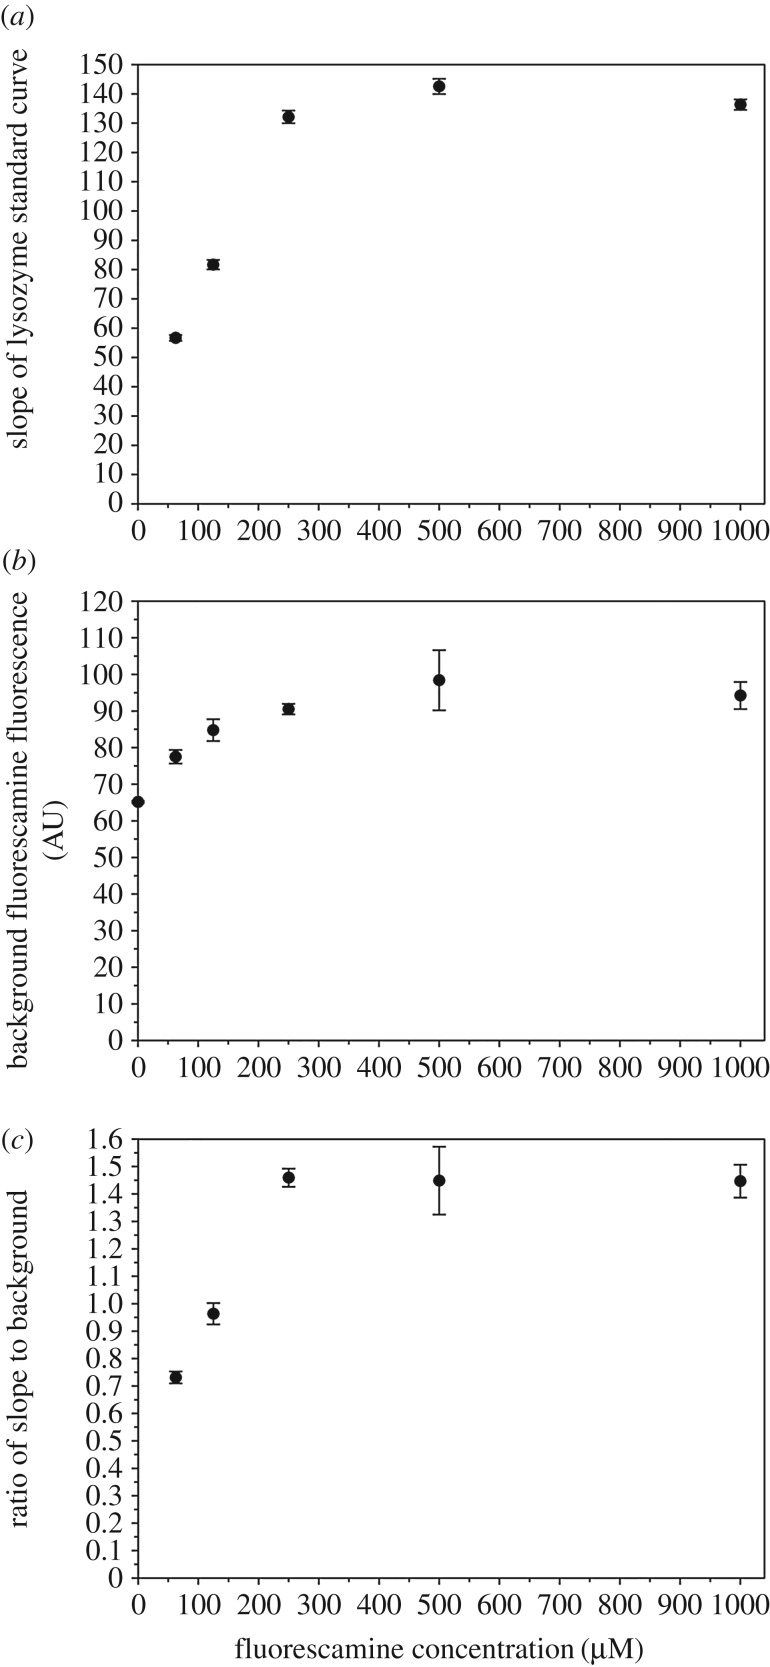
Optimal fluorescamine concentrations for best sensitivity. (a) The slope of the lysozyme standard curve from figure 1 as a function of fluorescamine concentrations used. (b) Background fluorescamine fluorescence in the absence of proteins from figure 1 as a function of fluorescamine concentration used. (c) Slope to background ratio as a function of fluorescamine concentration used.

