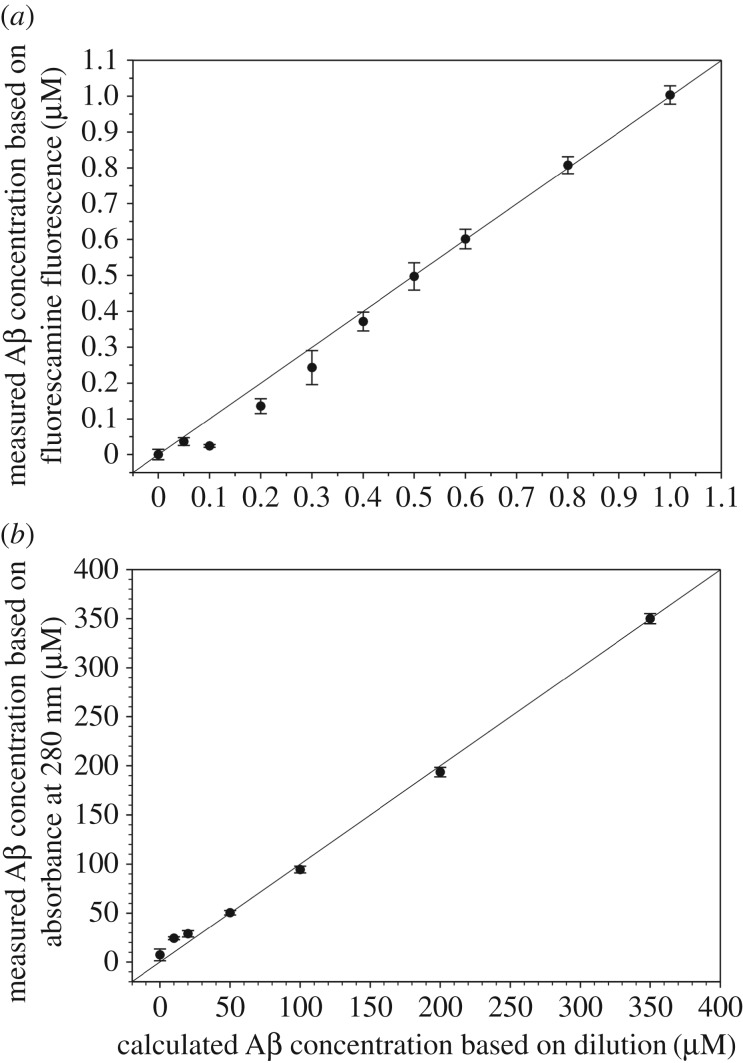
Figure 5.
Comparison of detection sensitivity for the fluorescamine and absorbance methods. (a) Measured Aβ42 concentrations using 500 µM fluorescamine are plotted as a function of calculated concentrations based on dilution. A data point on the diagonal line means perfect agreement between measured and calculated concentrations. Deviation from the diagonal line suggests that the measurements are losing accuracy. The measured concentrations for 0.5 µM or higher agree perfectly with calculated concentrations. The measurements for the 0.4 µM, 0.3 µM and 0.2 µM are 7%, 19% and 32% off from the calculated concentrations, respectively. Concentrations at 0.1 µM or lower gave fluorescence signal similar to background. (b) Measured Aβ42 concentrations using absorbance at 280 nm are plotted as a function of calculated concentrations based on dilution. Perfect agreements are shown at Aβ concentrations of 50 µM or higher. Deviations of 44% and 140% from calculated values are found for 20 and 10 µM Aβ. With perfect agreements at 0.5 µM Aβ for the fluorescamine method and at 50 µM Aβ for the absorbance method, the fluorescamine method is 100 times more sensitive than the absorbance method.

