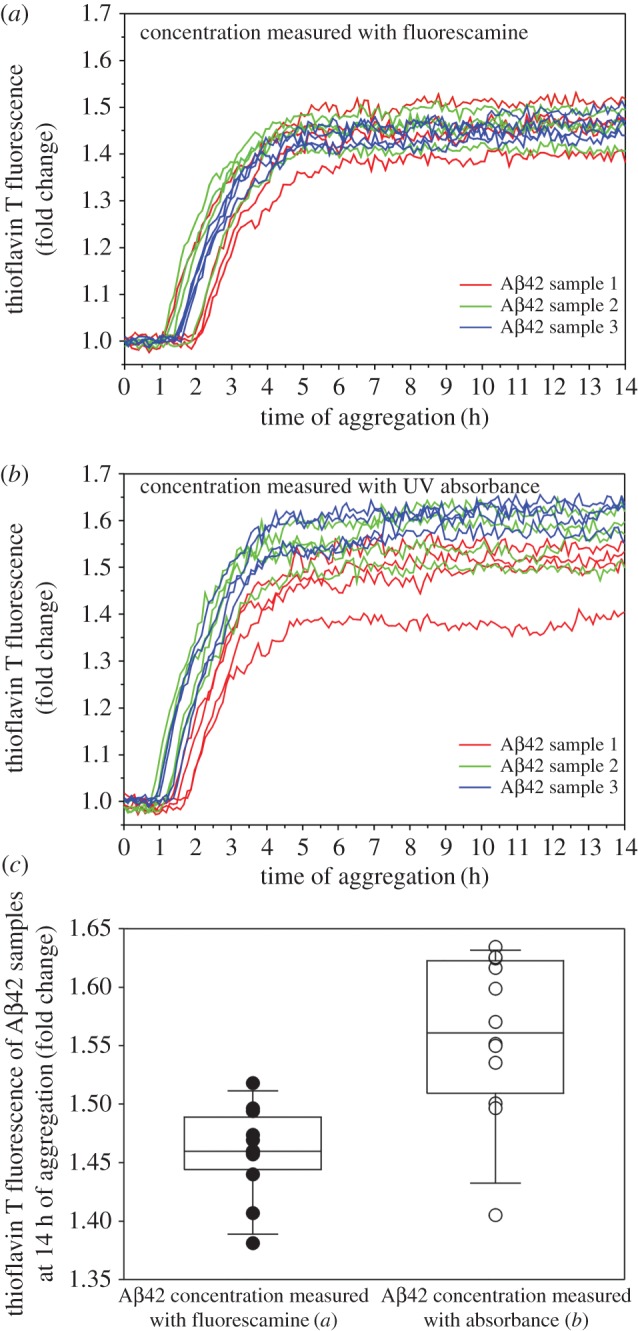
Figure 6.

Comparison of Aβ42 aggregation kinetics with concentrations determined using fluorescamine (a) or absorbance (b). (c) Thioflavin T fluorescence at aggregation plateau for all Aβ42 samples in (a) and (b) are superimposed on box plots to show the spread of fluorescence intensity. Whiskers of the box plot indicate the 10th and 90th percentiles. Three Aβ42 samples were prepared separately at approximately 30–40 µM in PBS buffer. For each sample, the concentration was determined using both fluorescamine and absorbance. Then four repeats of aggregation experiments were set up for each sample at 5 μM. The overall fluorescence intensity reaches similar values at aggregation plateau when concentrations are determined using fluorescamine (a) and absorbance (b), suggesting a general agreement of the two methods. However, aggregation curves for samples using the fluorescamine method are more tightly clustered together (c), suggesting better consistency with the fluorescamine method.
