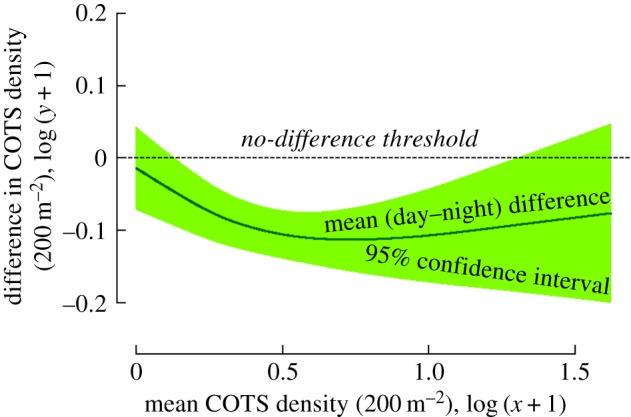
Figure 3.

Contrast curve identifying the domain of significant difference in estimations of seastar density between day and night surveys. Densities of the coral-killing seastar COTS were estimated every six months over a period of 2 years by day and night counts performed in permanent-transects established at nine reef locations (figure 2). The semi-parametric contrast curve [28,29] represents variation in the difference between day and night estimations (difference = day density − night density, y-axis) along the seastar density range (x-axis). The domain of significant difference is identified as the portion of the covariate (x-axis) for which the 95% confidence interval of the contrast curve (shaded area) does not cross the no-difference threshold (horizontal dashed line): COTS abundance was significantly lower in day counts compared to night in the log-density range 0.13–1.31, corresponding to the COTS density interval 0.4–19.3 seastar 200 m−2.
