Figure 2.
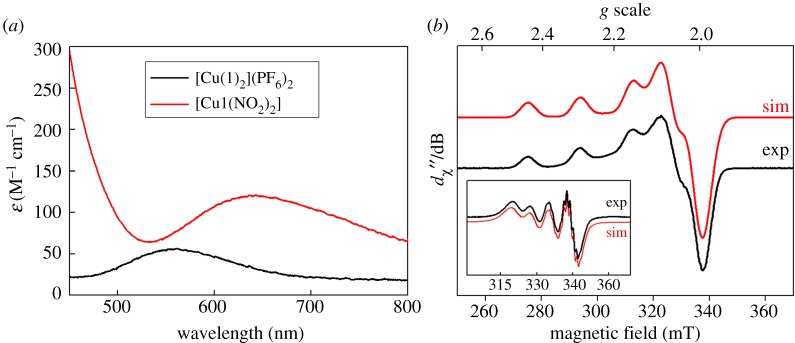
(a) UV–vis spectra of complex [Cu(1)2](PF6)2 in acetonitrile (black line) and of this complex after addition of 10 equivalents of TBA-NO2, yielding [Cu1(NO2)2] (red line). (b) The X-band EPR spectrum of [Cu(1)2](PF6)2 recorded in acetonitrile/dichloromethane solution at 130 K (conditions: frequency, 9.4201 GHz; power, 2.0 mW; modulation, 0.2 mT). Experimental data are represented by the black line and the simulation is depicted by the red trace; simulation parameters are given in the text. The inset shows the fluid solution spectrum at 293 K (experimental conditions: frequency, 9.854 GHz; power, 10 mW; modulation, 0.5 mT).

