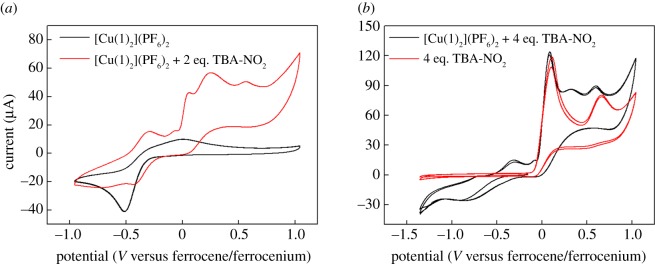
Figure 9.
Cyclic voltammograms of a 2.8 mM acetonitrile solution of complex [Cu(1)2]2+ containing 0.1 M TBA-PF6 and various amounts of TBA-NO2 run under the conditions detailed in the ‘Experimental section’. (a) The black trace shows the behaviour of [Cu(1)2]2+ on its own, and the red trace that of [Cu(1)2]2+ in the presence of 2 equivalents of TBA-NO2. (b) The black trace shows the behaviour of [Cu(1)2]2+ in the presence of 4 equivalents of TBA-NO2, and the red trace that of the equivalent amount of TBA-NO2 on its own.

