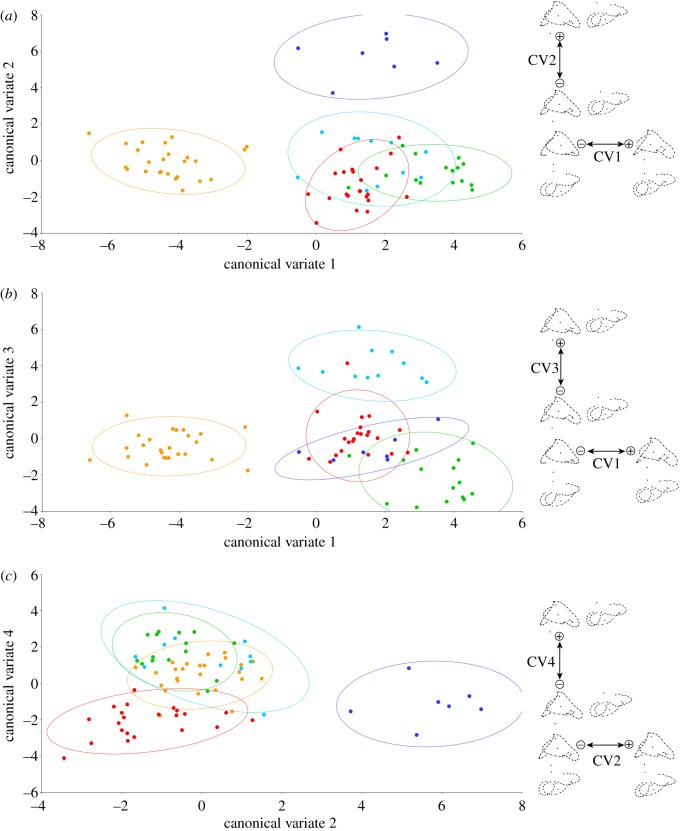
Figure 4.
Distribution of 80 taxa (all except Dinilysia, whose ecology is unknown) in the morphospace of inner ears plotted against the first four canonical variates (ordinary CVA). (a) CV2 plotted against CV1; (b) CV3 plotted against CV1; (c) CV4 plotted against CV2. Orange colour indicates fossorial (s.l.) taxa; cyan indicates semi-aquatic taxa; blue indicates fully aquatic taxa; green indicates arboreal taxa; and red indicates generalist taxa. 90% confidence ellipses for each ecological group are also shown. Diagrams to the right are projections of the Procrustes landmark configurations towards the positive and negative extremes of each axis, in lateral and dorsal (to the right or below the former) views; anterior is to the right in all projections.

