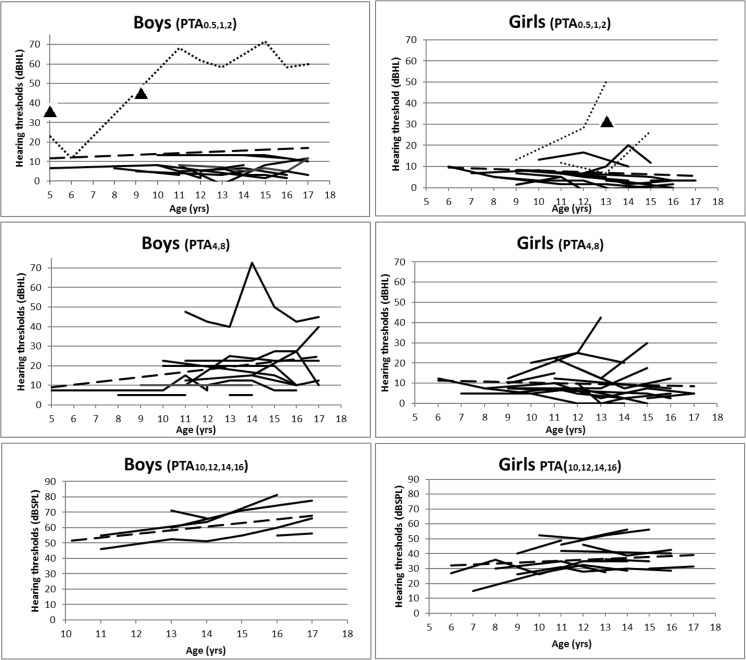
Fig. 1.
Individual audiometric results of all follow-up data for low (PTA.5,1,2), high (PTA4,8), and ultra-high (PTA10,12,14,16) frequencies. Boys are shown in the left column, girls in the right. Dashed line is the trend-line. Spotted line in PTA.5,1,2 demonstrates the three children who developed HL during follow-up. Triangles represent children with HL of whom only one audiogram was available

