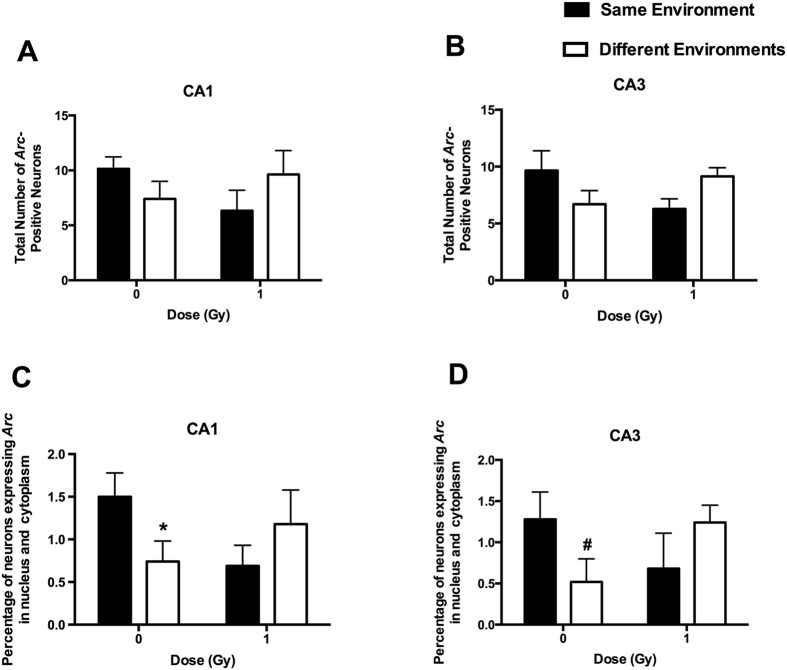
Figure 4.
A comparable total number of Arc-positive neurons in the CA1 (A) and CA3 (B) regions of the hippocampus at the 2-week time point. The percentage of Arc-positive neurons in the CA1 region of the hippocampus at the 2-week time point. (C) The percentage of Arc-positive neurons in the CA1 region of the hippocampus of sham-irradiated mice was higher following exposure to twice the same environment than two different environments. This was not seen in irradiated mice. (D) There was a trend towards a higher percentage of Arc-positive neurons expressing Arc mRNA in the nucleus and cytoplasm in the CA3 region of the hippocampus following exposure twice to the same environment, as opposed to exposure to two different environments in sham-irradiated mice but that did not reach significance. *p < 0.05 versus same environment; # p = 0.0578. N = 5–7 mice/dose/environment.

