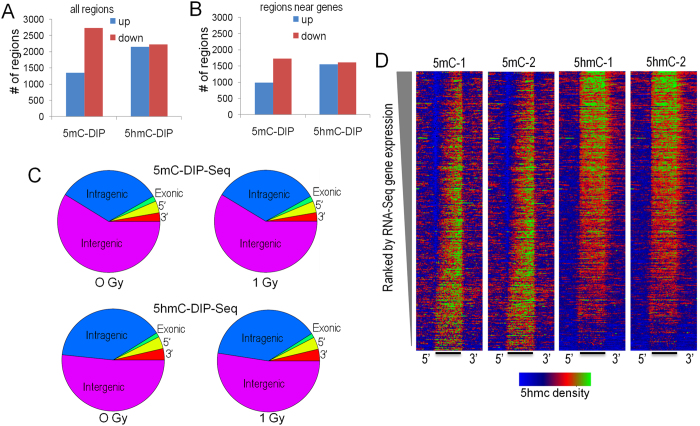
Figure 5.
(A) Number of regions with significantly increased (blue) and decreased (red) 5hmC and 5 mC. (B) Number of significantly-regulated regions within 25 kb of a RefSeq gene start site. (C) Venn Diagrams depicting the annotation of differentially methylated and hydroxymethylated regions relative to gene boundaries. (D) DIP-Seq density histograms illustrating 5mC and 5hmC levels at RefSeq genes sorted by RNA-Seq gene expression levels. 5′ and 3′ indicate distal regions and the bar represents the normalized RefSeq transcript length. Color scale: blue depicts lower density with green and red showing higher density.

