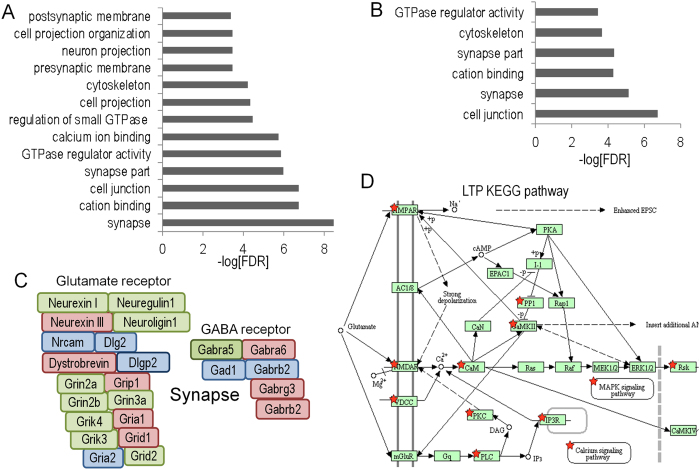
Figure 6.
Gene ontology analyses of upregulated 5hmC DHRs (A) and downregulated DHRs. (B) DHRs were annotated with the closest RefSeq gene start site within 50 kb. (C) Selected genes from the synapse gene ontology category. Green depicts genes found in upregulated DHRs, red depicts genes found in down-regulated DHRs and blue depicts genes found in both categories. (D) KEGG pathway analysis shows that up and down-regulated DHRs are both enriched for the same set of LTP-associated genes. p < 1 × 10⁻⁶. The KEGG database was developed by the Kanehissa Laboratories, as described75.

