Fig. 1.

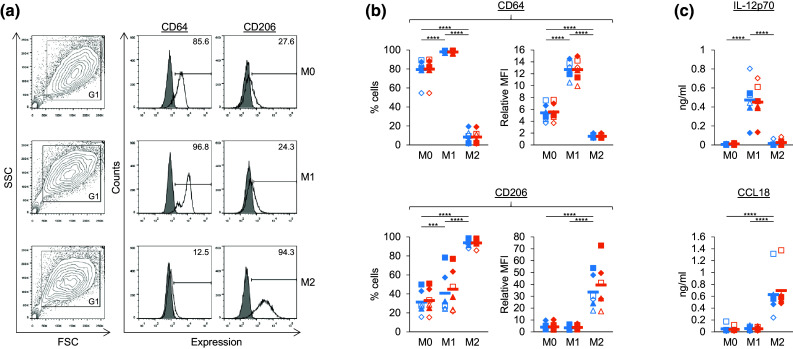
Characterisation of M1 and M2 Mϕs treated with or without ZA. a, b Flow cytometry was used to measure the expression of CD64 and CD206 on M0, M1 and M2 Mϕs treated with (orange) or without (blue) ZA for the last 18 h of culture. a Representative flow cytometry plots from one of six donors (−ZA). Dead cells and debris were excluded based on forward scatter (FSC) and side scatter (SSC) using gate (G) 1. Unfilled overlays = test, filled overlays = isotype. Numbers on the plots are percentage of cells within the marker. b Individual data points and means for six donors. Test MFIs for the total G1 population were divided by isotype controls to obtain relative MFIs. c M0, M1 and M2 Mϕs treated with (orange) or without (blue) ZA for the last 18 h of culture were cultured overnight in fresh medium with or without 100 ng/ml LPS. The concentration of IL-12p70 and CCL18 in culture supernatants was measured using ELISAs. Data for IL-12p70 is in the presence of LPS, whereas data for CCL18 is in the absence of LPS. Individual data points and means for six donors are shown. For b and c, data were analysed by repeated measures two-way ANOVA and comparisons between means carried out using Tukey’s multiple comparison tests. *** and **** indicate p values of <0.001 and <0.0001, respectively. Statistical differences for comparisons within the +ZA (orange) data sets are not shown
